nowo-tech / performance-bundle
Symfony bundle for tracking and analyzing route performance metrics. Records request time, database queries count, and query execution time for performance analysis.
Package info
github.com/nowo-tech/PerformanceBundle
Type:symfony-bundle
pkg:composer/nowo-tech/performance-bundle
Fund package maintenance!
Requires
- php: >=8.1 <8.6
- doctrine/dbal: ^3.8.2 || ^4.0
- doctrine/doctrine-bundle: ^2.8 || ^3.0
- doctrine/orm: ^2.13 || ^3.0
- symfony/form: ^6.0 || ^7.0 || ^8.0
- symfony/framework-bundle: ^6.0 || ^7.0 || ^8.0
- symfony/security-bundle: ^6.0 || ^7.0 || ^8.0
- symfony/stopwatch: ^6.0 || ^7.0 || ^8.0
- symfony/translation: ^6.0 || ^7.0 || ^8.0
- symfony/twig-bundle: ^6.0 || ^7.0 || ^8.0
- symfony/ux-icons: ^2.0 || ^3.0
- symfony/var-exporter: ^6.0 || ^7.0 || ^8.0
- symfony/yaml: ^6.0 || ^7.0 || ^8.0
Requires (Dev)
- friendsofphp/php-cs-fixer: ^3.0
- phpstan/extension-installer: ^1.0
- phpstan/phpstan: ^2.0
- phpstan/phpstan-phpunit: ^2.0
- phpstan/phpstan-symfony: ^2.0
- phpunit/phpunit: ^10.0
- rector/rector: ^2.0
- symfony/browser-kit: ^6.0 || ^7.0 || ^8.0
- symfony/dom-crawler: ^6.0 || ^7.0 || ^8.0
- symfony/http-client: ^6.0 || ^7.0 || ^8.0
- symfony/mailer: ^6.0 || ^7.0 || ^8.0
- symfony/mime: ^6.0 || ^7.0 || ^8.0
- symfony/ux-twig-component: ^2.0 || ^3.0
Suggests
- symfony/http-client: For webhook notifications (Slack, Teams, custom webhooks)
- symfony/mailer: For email notifications
- symfony/ux-twig-component: For dashboard Twig Component mode ({{ component() }}); without it, the bundle uses traditional Twig includes
- dev-main
- v2.0.17
- v2.0.16
- v2.0.15
- v2.0.14
- v2.0.13
- v2.0.12
- v2.0.11
- v2.0.10
- v2.0.9
- v2.0.8
- v2.0.7
- v2.0.6
- v2.0.5
- v2.0.4
- v2.0.3
- v2.0.2
- v2.0.1
- v2.0.0
- v1.0.8
- v1.0.6
- v1.0.5
- v1.0.4
- v1.0.3
- v1.0.2
- v1.0.1
- v1.0.0
- v0.0.7
- v0.0.6
- v0.0.5
- v0.0.4
- v0.0.3
- v0.0.2
- v0.0.1
- dev-dependabot/github_actions/actions/github-script-9
- dev-dependabot/github_actions/codecov/codecov-action-6
This package is auto-updated.
Last update: 2026-04-15 11:44:04 UTC
README
⭐ Found this useful? Give it a star on GitHub! It helps us maintain and improve the project.
Symfony bundle for tracking and analyzing route performance metrics. Automatically records request time, database query count, and query execution time for performance analysis.
📋 Compatible with Symfony 6.1+, 7.x, and 8.x - This bundle requires Symfony 6.1 or higher.
What is this?
This bundle helps you track and analyze route performance in your Symfony applications:
- 📊 Automatic Performance Tracking - Automatically tracks route performance metrics
- 🔍 Query Analysis - Counts and times database queries per route
- ⏱️ Request Timing - Measures request execution time
- 📈 Performance Analysis - Identifies slow routes and query-heavy endpoints
- 🎯 Route Metrics - Stores metrics per route and environment
- 🔧 Manual Updates - Command to manually set/update route metrics
Quick Search Terms
Looking for: route performance, performance monitoring, query tracking, Symfony performance, route metrics, performance analysis, database query tracking, request timing, profiling, performance bundle? You've found the right bundle!
Features
- ✅ Automatic route performance tracking via event subscribers
- ✅ Database query counting and execution time tracking
- ✅ Request execution time measurement
- ✅ Memory usage tracking - Track peak memory consumption per route
- ✅ Access frequency tracking - Track how often routes are accessed
- ✅ HTTP status code tracking - Track and calculate ratios for HTTP status codes (200, 404, 500, etc.)
- ✅ Sub-request tracking - Optional tracking of sub-requests (ESI, fragments, includes) in addition to main requests
- ✅ Performance notifications - Email, Slack, Teams, and webhook notifications for performance alerts
- ✅ Route data persistence in database
- ✅ Environment-specific metrics (dev, test, prod)
- ✅ Configurable route ignore list
- ✅ Command to manually set/update route metrics
- ✅ Support for multiple Doctrine connections
- ✅ Performance dashboard with filtering and sorting
- ✅ Data export - CSV and JSON export functionality
- ✅ Record management - Delete individual records (optional)
- ✅ Review system - Mark and edit records as reviewed with improvement tracking (optional)
- ✅ Bootstrap and Tailwind CSS support - Choose your preferred CSS framework
- ✅ Role-based access control for dashboard
- ✅ WebProfiler integration with ranking information
- ✅ Chart.js integration - Interactive performance charts
- ✅ Symfony UX Twig Components - Optional modern component system
- ✅ Symfony 6.1+, 7.x, and 8.x compatible
- ✅ FrankenPHP — Compatible with FrankenPHP; production Caddyfile can use worker mode, while dev demos use
APP_ENV=devso the image entrypoint swaps inCaddyfile.dev(no worker, comfortable local dev). See docs/DEMO-FRANKENPHP.md and the demo READMEs.
Screenshots
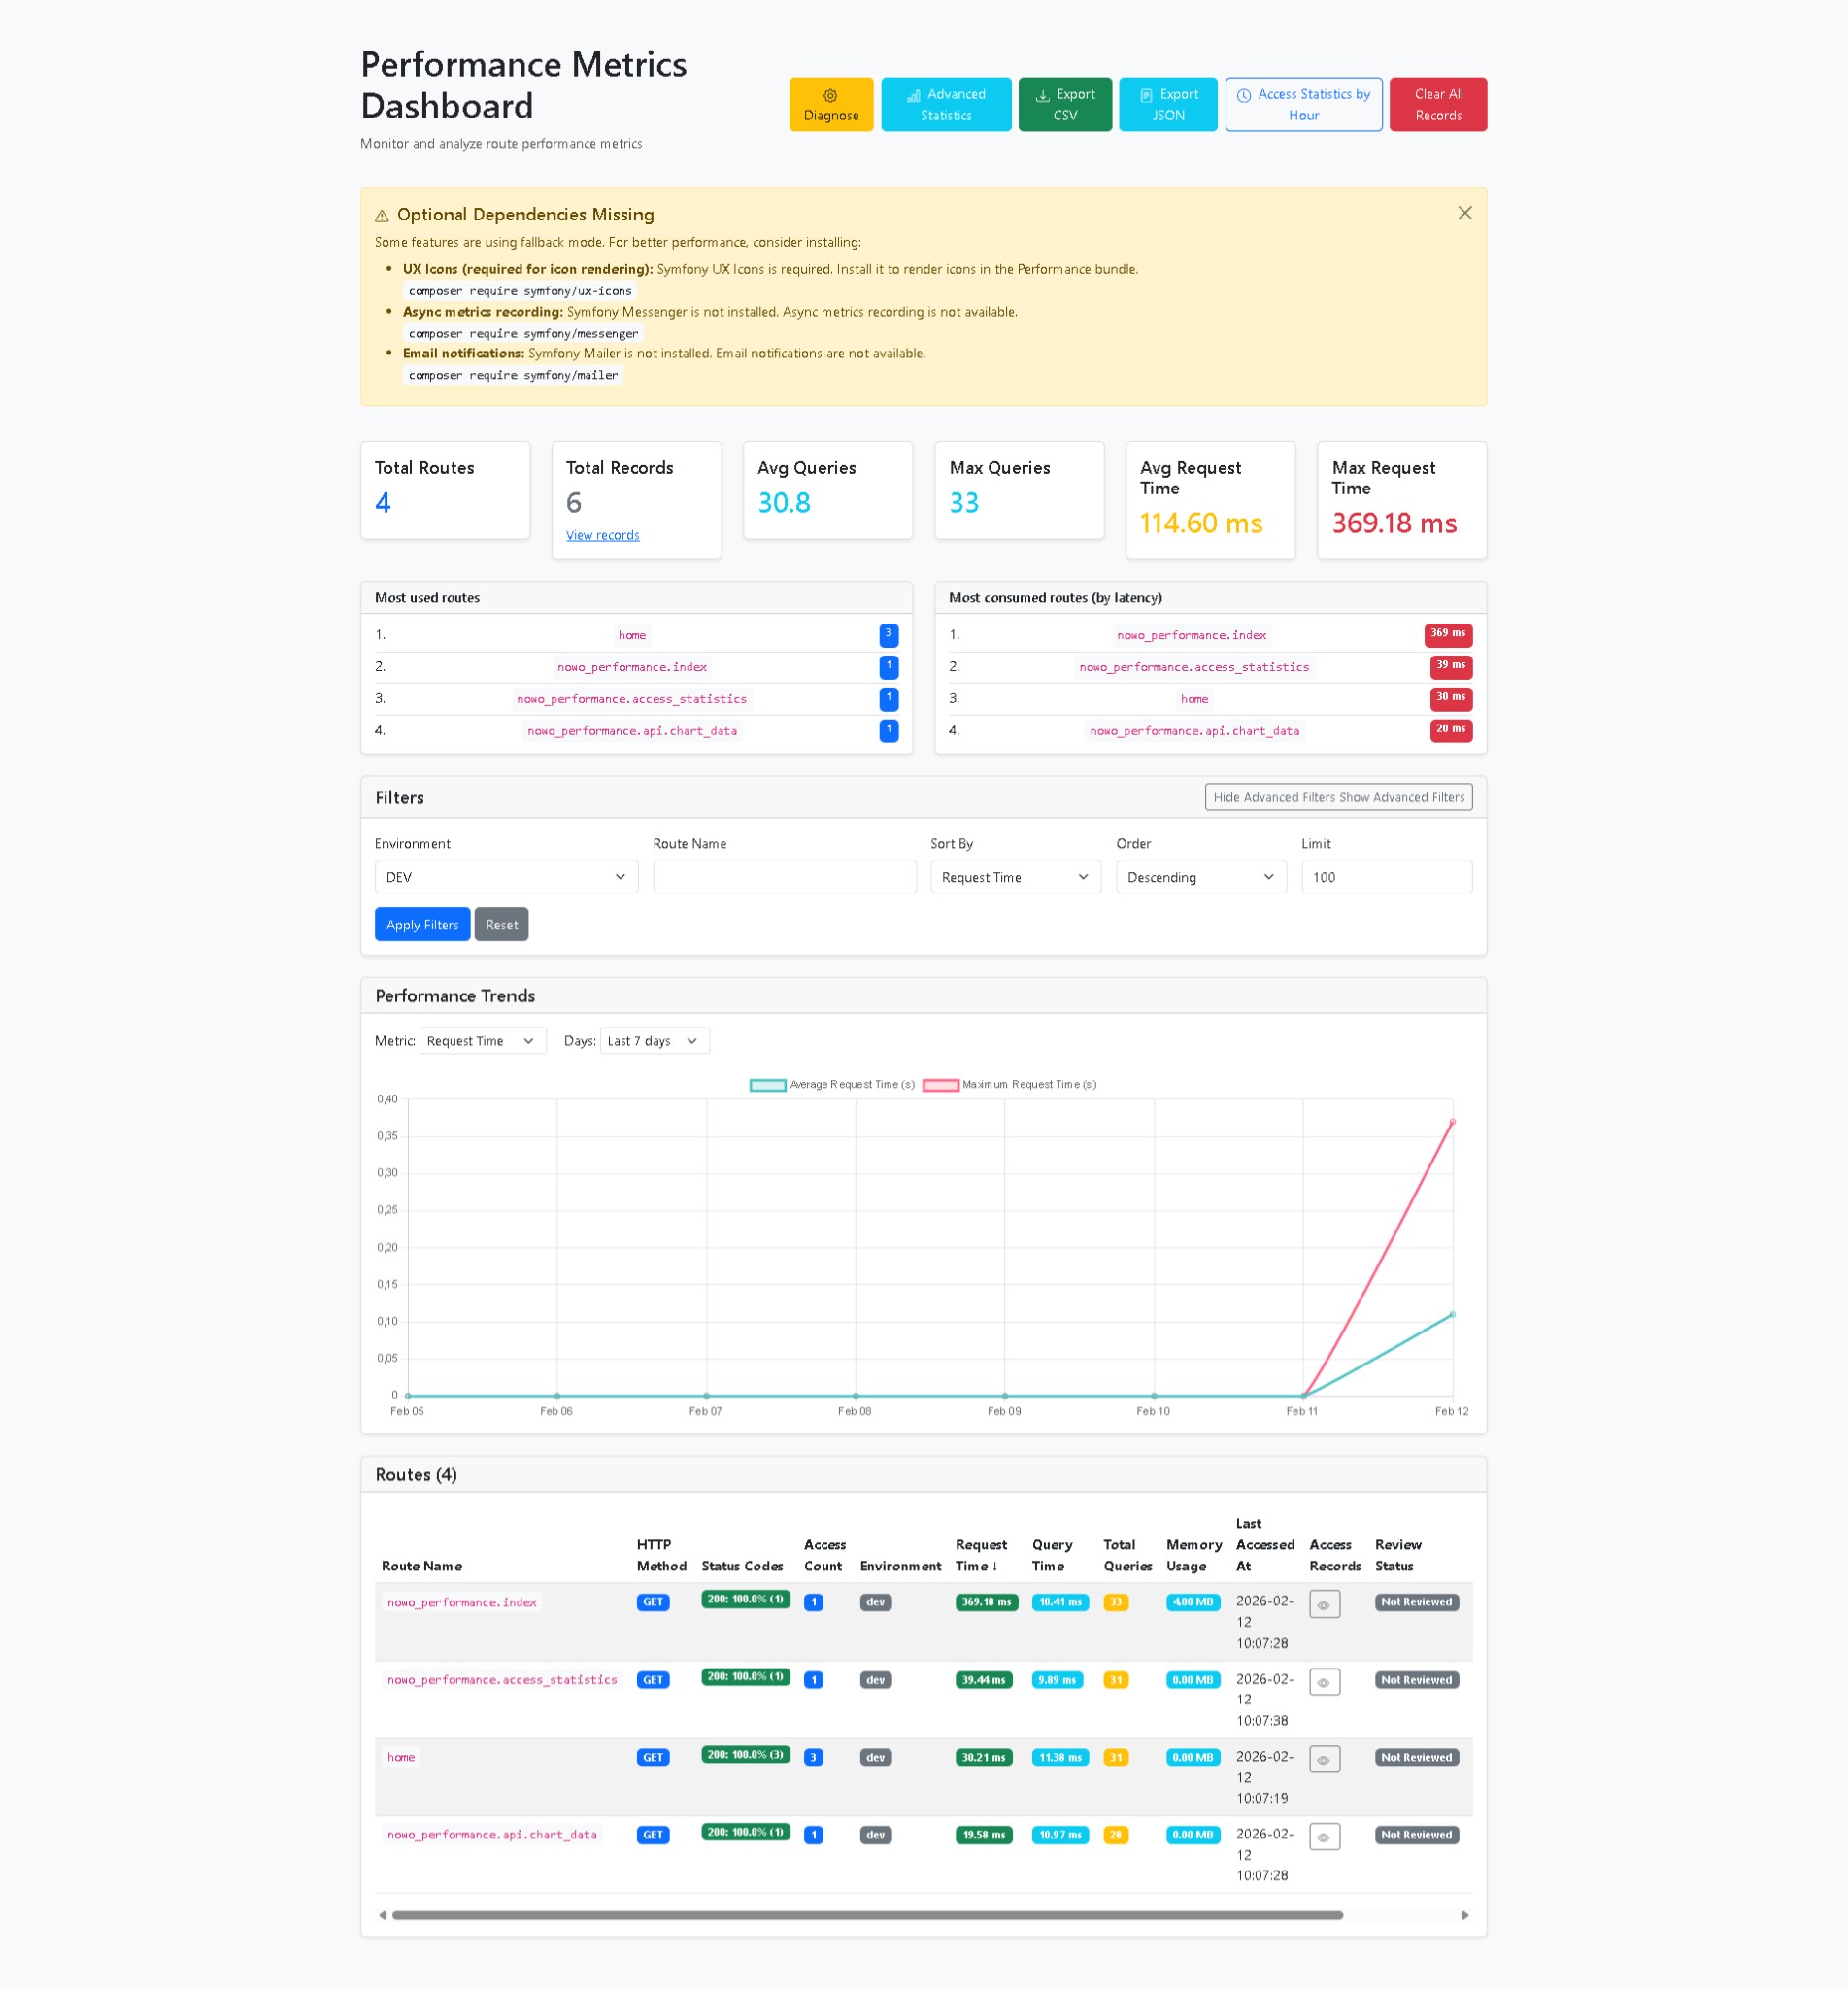
The bundle provides a web dashboard to monitor and analyze route performance. Below are the main views.
Performance Metrics Dashboard
The main dashboard shows KPIs (total routes, records, average/max queries and request time), top routes by usage and by latency, filters (environment, sort, limit), an optional “Optional Dependencies Missing” alert with composer require hints, a Performance Trends chart (average and max request time over days), and a Routes table with columns: route name, HTTP method, status codes, access count, environment, request time, query time, total queries, memory usage, last accessed at, access records link, and review status.
Access: dashboard path configured in nowo_performance.dashboard.path (e.g. /performance). Use Diagnose, Advanced Statistics, Export CSV/JSON, Access Statistics by Hour, and Clear All Records from the toolbar.
Advanced Performance Statistics
This view provides statistical analysis to find optimization targets: Performance Recommendations (e.g. high average query count, request time outliers), Correlation Analysis (request time vs query time, query time vs query count, memory vs request time), Efficiency Analysis (query time ratio), Traffic Distribution and hot/bad routes, Routes Needing Attention (high request time or query count by percentile), and detailed Request Time, Query Time, Query Count, Memory Usage, and Access Count sections with min/mean/median/max, percentiles, and distribution histograms.
Access: Advanced Statistics button from the main dashboard. Requires enough route data for meaningful stats.
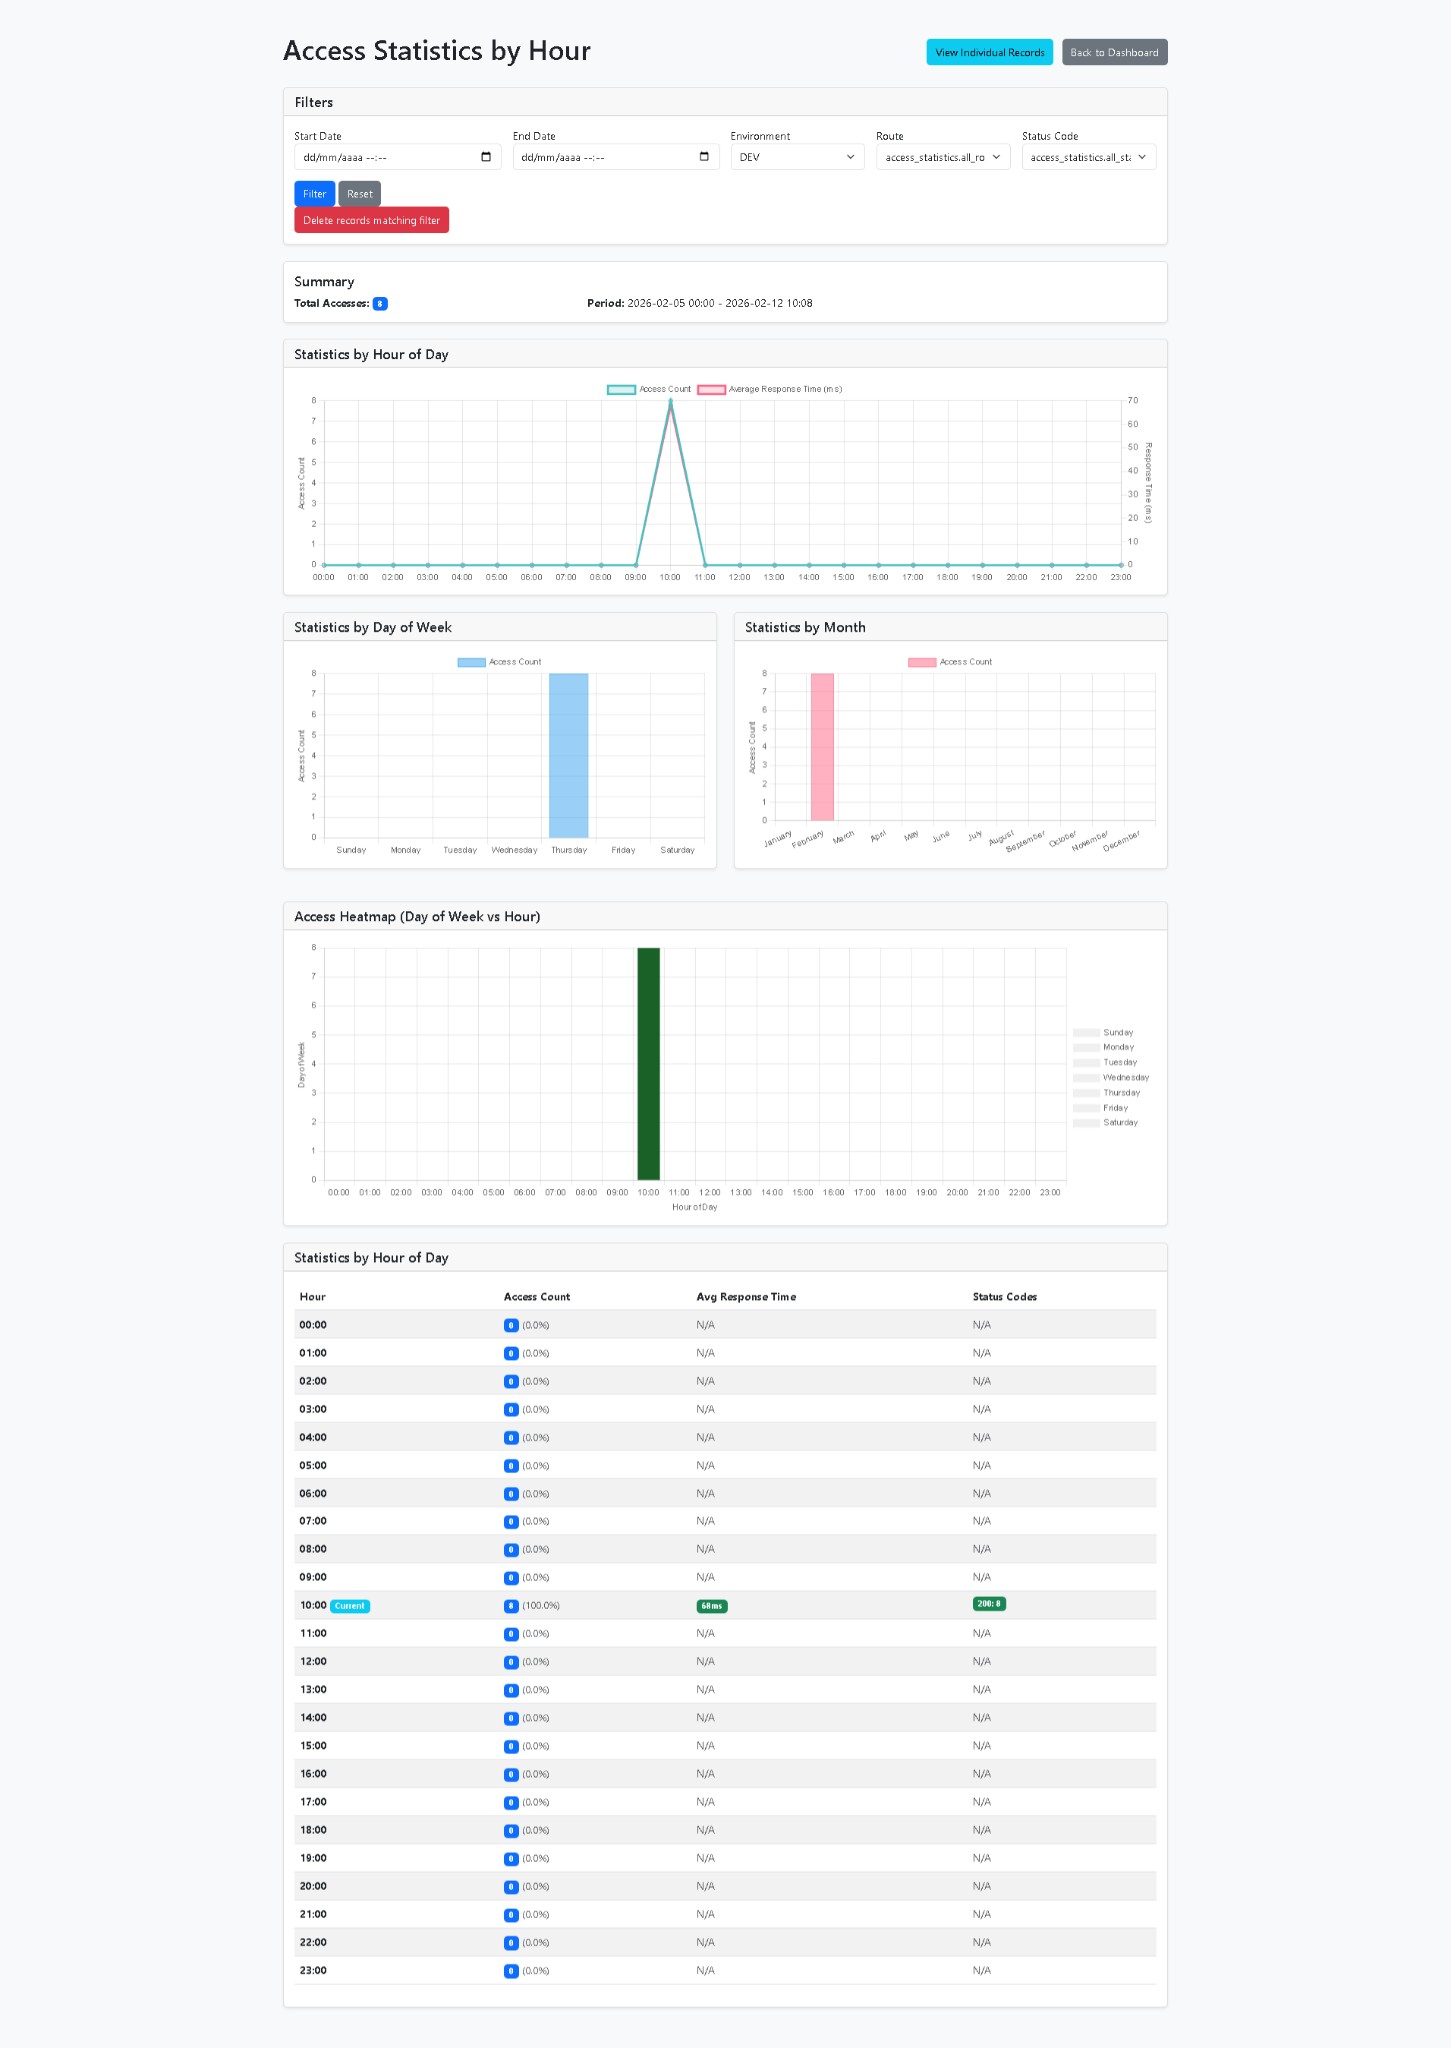
Access Statistics by Hour
When temporal access records are enabled (enable_access_records: true), this page shows access patterns over time: filters (date range, environment, route, status code), Total Accesses and period, Statistics by Hour of Day (line chart: access count and average response time), Statistics by Day of Week and by Month (bar charts), Access Heatmap (day of week vs hour), and a detailed table by hour with access count, average response time, and status code breakdown. You can Delete records matching filter from here.
Access: Access Statistics by Hour from the main dashboard. Requires enable_access_records: true and the routes_data_records table (see Configuration).
Installation
composer require nowo-tech/performance-bundle
Then, register the bundle in your config/bundles.php:
<?php

return [
  // ...
  Nowo\PerformanceBundle\NowoPerformanceBundle::class => ['all' => true],
];
Quick Start
- Configure the bundle (optional - works with defaults):
# config/packages/nowo_performance.yaml
nowo_performance:
  enabled: true
  environments: ['prod', 'dev', 'test']
  connection: 'default'
  track_queries: true
  track_request_time: true
  ignore_routes:
    - '_wdt'
    - '_profiler'
    - 'web_profiler*'
    - '_error'
    dashboard:
      enabled: true
      path: '/performance'
      template: 'bootstrap' # or 'tailwind'
      roles: ['ROLE_ADMIN'] # Optional: restrict access
- Create the database table(s):
Option A: Using the bundle commands (Recommended):
php bin/console nowo:performance:create-table
# If you use temporal access records (enable_access_records: true):
php bin/console nowo:performance:create-records-table
# Or sync both tables in one go (add/alter columns from entities):
php bin/console nowo:performance:sync-schema
Option B: Using Doctrine Schema:
php bin/console doctrine:schema:update --force
# or
php bin/console doctrine:migrations:diff
php bin/console doctrine:migrations:migrate
- That's it! The bundle will automatically track route performance metrics in the configured environments.
For detailed installation steps (including sync-schema and migrations), see Installation Guide.
Usage
Automatic Tracking
The bundle automatically tracks performance metrics for all routes (except ignored ones) in configured environments.
Manual Metrics Update
Use the command to inject sample metrics through the same PerformanceMetricsService pipeline as HTTP tracking (updates RouteData; may append RouteDataRecord rows when enable_access_records is enabled — same rules as live requests):
# Set route metrics
php bin/console nowo:performance:set-route app_home \
  --env=dev \
  --request-time=0.5 \
  --queries=10 \
  --query-time=0.2

# Another example with more metrics
php bin/console nowo:performance:set-route app_user_show \
  --env=prod \
  --request-time=1.2 \
  --queries=25 \
  --query-time=0.3 \
  --params='{"id":123}'
Accessing Metrics
use Nowo\PerformanceBundle\Service\PerformanceMetricsService;

// Get route data
$routeData = $metricsService->getRouteData('app_home', 'dev');

// Get all routes for environment
$routes = $metricsService->getRoutesByEnvironment('dev');

// Get worst performing routes
$worstRoutes = $metricsService->getWorstPerformingRoutes('dev', 10);
Requirements
- PHP >= 8.1, < 8.6
- Symfony 6.1+, 7.x, or 8.x
- Doctrine ORM ^2.13 || ^3.0
- Doctrine Bundle ^2.8 || ^3.0 (3.0 required for Symfony 8)
Configuration
The bundle works with default settings. Create config/packages/nowo_performance.yaml. For the full reference and all options, see Configuration Guide.
nowo_performance:
  enabled: true
  environments: ['prod', 'dev', 'test']
  connection: 'default'
  table_name: 'routes_data'
  track_queries: true
  track_request_time: true
  track_sub_requests: false
  ignore_routes:
    - '_wdt'
    - '_profiler'
    - 'web_profiler*'
    - '_error'
  dashboard:
    enabled: true
    path: '/performance'
    template: 'bootstrap' # or 'tailwind'
    roles: [] # empty = unrestricted
Commands
See Commands for full documentation. Main commands:
nowo:performance:create-table- Create or update the main metrics table (routes_data)nowo:performance:create-records-table- Create or update the access records table (routes_data_records); use whenenable_access_records: truenowo:performance:sync-schema- Sync both tables with entity metadata (add/alter columns)nowo:performance:set-route- Set or update route performance metrics manuallynowo:performance:diagnose- Diagnostic report of bundle configuration, tables, and tracking statusnowo:performance:check-dependencies- Check status of optional dependencies (UX Icons, Messenger, Mailer)nowo:performance:purge-records- Purge old access records (by age or all)nowo:performance:rebuild-aggregates- RebuildRouteDataaggregates from access records
Entity structure (v2.x)
Since 2.0.0, metrics are normalized: RouteData holds route identity and review metadata; per-request metrics live in RouteDataRecord (and dashboard/API use aggregates built from records). See V2_MIGRATION.md and ENTITY_NORMALIZATION_PLAN.md.
RouteData (routes_data) — one row per logical route + environment:
id,env,name,httpMethod,paramscreatedAt,lastAccessedAt- Review:
reviewed,reviewedAt,reviewedBy,queriesImproved,timeImproved saveAccessRecords— when access records are enabled globally, you can disable per-route record creation
RouteDataRecord (routes_data_records) — optional temporal log when enable_access_records: true (one row per request, deduplicated by request_id when set):
- Timing and load:
responseTime,totalQueries,queryTime,memoryUsage,statusCode,accessedAt - Context:
route_params,route_path,referer,user_identifier,user_id,request_id
Listed metrics (request time, query counts, status code ratios, etc.) in the UI and exports are computed from records (or cached aggregates), not stored as scalar columns on RouteData.
How It Works
- Event Subscriber (
PerformanceMetricsSubscriber) listens to kernel events - On
KernelEvents::REQUEST, it starts tracking:
- Request start time
- Resets query tracking middleware
- On
KernelEvents::TERMINATE, it:
- Calculates request time
- Collects query count and execution time using multiple strategies:
- Primary:
QueryTrackingMiddleware(DBAL middleware for DBAL 3.x compatibility) - Fallback 1:
DoctrineDataCollectorfrom Symfony profiler - Fallback 2: Request attributes (
_profiler,_profiler_profile) - Fallback 3: Stopwatch (time only)
- Persists via
PerformanceMetricsService: updatesRouteData(identity +lastAccessedAt); whenenable_access_recordsis on, inserts aRouteDataRecordfor that request (subject to deduplication and per-routesaveAccessRecords), unless metrics are recorded asynchronously (async: truewith Messenger)
Query Tracking Architecture
The bundle uses a multi-layered approach for query tracking:
- QueryTrackingMiddleware: A custom DBAL middleware that intercepts all database queries at the driver level. This is the primary method and works with DBAL 3.x (which removed
SQLLogger). - DoctrineDataCollector: Falls back to Symfony's built-in profiler data collector if the middleware is not available.
- Request Attributes: Attempts to access profiler data from request attributes for sub-requests.
- Stopwatch: Last resort fallback for timing information only (does not provide query count).
This ensures reliable query tracking across different Symfony and Doctrine versions.
Documentation
Additional documentation
- Demo with FrankenPHP (development and production)
- Commands
- Events & priorities
- Behaviour and notable changes
- Compatibility
- Notifications
Testing
# Run tests
composer test

# Run with coverage
composer test-coverage
Tests and coverage
- Tests: PHPUnit (PHP)
- PHP: ~94% lines (run
make test-coveragefor the current summary; badge rounded)
License
The MIT License (MIT). Please see LICENSE for more information.
Contributing
We welcome contributions! Please see CONTRIBUTING.md for details.
Author
Created by Héctor Franco Aceituno at Nowo.tech


