johnbillion / query-monitor
Query Monitor is the developer tools panel for WordPress and WooCommerce.
Package info
github.com/johnbillion/query-monitor
Type:wordpress-plugin
pkg:composer/johnbillion/query-monitor
Fund package maintenance!
Requires
- php: >=7.4.0
- composer/installers: ^1.0 || ^2.0
Requires (Dev)
- dealerdirect/phpcodesniffer-composer-installer: 0.7.2
- guzzlehttp/guzzle: ^7.0
- johnbillion/plugin-infrastructure: 2.9.0
- johnbillion/wp-compat: 1.4.0
- php-stubs/wordpress-stubs: 6.9.0
- php-stubs/wp-cli-stubs: 2.12.0
- phpcompatibility/phpcompatibility-wp: 2.1.5
- phpstan/phpstan: 2.1.46
- phpstan/phpstan-deprecation-rules: 2.0.4
- phpstan/phpstan-phpunit: 2.0.16
- squizlabs/php_codesniffer: 3.11.1
- szepeviktor/phpstan-wordpress: 2.0.3
- wp-coding-standards/wpcs: 2.3.0
- dev-develop
- 4.0.6
- 4.0.5
- 4.0.4
- 4.0.3
- 4.0.2
- 4.0.1
- 4.0.0
- 4.0.0-beta.3
- 4.0.0-beta.2
- 4.0.0-beta.1
- 4.0.0-alpha.2
- 4.0.0-alpha.1
- 3.20.4
- 3.20.3
- 3.20.2
- 3.20.1
- 3.20.0
- 3.19.0
- 3.18.0
- 3.17.2
- 3.17.1
- 3.17.0
- 3.16.4
- 3.16.3
- 3.16.2
- 3.16.1
- 3.16.0
- 3.15.0
- 3.14.1
- 3.14.0
- 3.13.1
- 3.13.0
- 3.12.3
- 3.12.2
- 3.12.1
- 3.12.0
- 3.11.2
- 3.11.1
- 3.11.0
- 3.10.1
- 3.10.0
- 3.9.0
- 3.8.2
- 3.8.1
- 3.8.0
- 3.7.1
- 3.7.0
- 3.6.8
- 3.6.7
- 3.6.6
- 3.6.5
- 3.6.4
- 3.6.3
- 3.6.2
- 3.6.1
- 3.6.0
- 3.5.2
- 3.5.1
- 3.5.0
- 3.4.0
- 3.3.7
- 3.3.6
- 3.3.5
- 3.3.4
- 3.3.3
- 3.3.2
- 3.3.1
- 3.3.0
- 3.2.2
- 3.2.1
- 3.2.0
- 3.1.1
- 3.1.0
- 3.0.1
- 3.0.0
- 2.17.0
- 2.16.2
- 2.16.1
- 2.16.0
- 2.15.0
- 2.14.0
- 2.13.4
- 2.13.3
- 2.13.2
- 2.13.1
- 2.13.0
- 2.12.0
- 2.11.4
- 2.11.3
- 2.11.2
- 2.11.1
- 2.11.0
- 2.10.0
- 2.9.1
- 2.9.0
- 2.8.1
- 2.8.0
- 2.7.4
- 2.7.3
- 2.7.2
- 2.7.1
- 2.7.0
- 2.6.10
- 2.6.9
- 2.6.8
- 2.6.7
- 2.6.6
- 2.6.5
- 2.6.4
- 2.6.3
- 2.6.2
- 2.6.1
- 2.6
- 2.5.6
- 2.5.5
- 2.5.4
- 2.5.3
- 2.5.2
- dev-test-plugin-infrastructure/dependabot/github_actions/github-actions-6e9ddacb83
- dev-copilot/restore-log-count-indicator
- dev-test-plugin-infrastructure/ignore-scripts
- dev-test-plugin-infrastructure/dependabot/github_actions/github-actions-c6819f84d5
- dev-release-4.0.6
- dev-release
- dev-trunk
- dev-release-4.0.5
- dev-release-4.0.4
- dev-release-4.0.3
- dev-release-4.0.2
- dev-release-4.0.1
- dev-release-4.0.0
- dev-sqlite-integration
- dev-release-3.20.4
- dev-release-3.20.3
- dev-master
This package is auto-updated.
Last update: 2026-04-23 16:51:15 UTC
README
Query Monitor
Query Monitor is the developer tools panel for WordPress and WooCommerce. It enables debugging of database queries, PHP errors, hooks and actions, block editor blocks, enqueued scripts and stylesheets, HTTP API calls, and more.
It includes some advanced features such as debugging of Ajax calls, REST API calls, user capability checks, and full support for block themes and full site editing. It includes the ability to narrow down much of its output by plugin or theme, allowing you to quickly determine poorly performing plugins, themes, or functions.
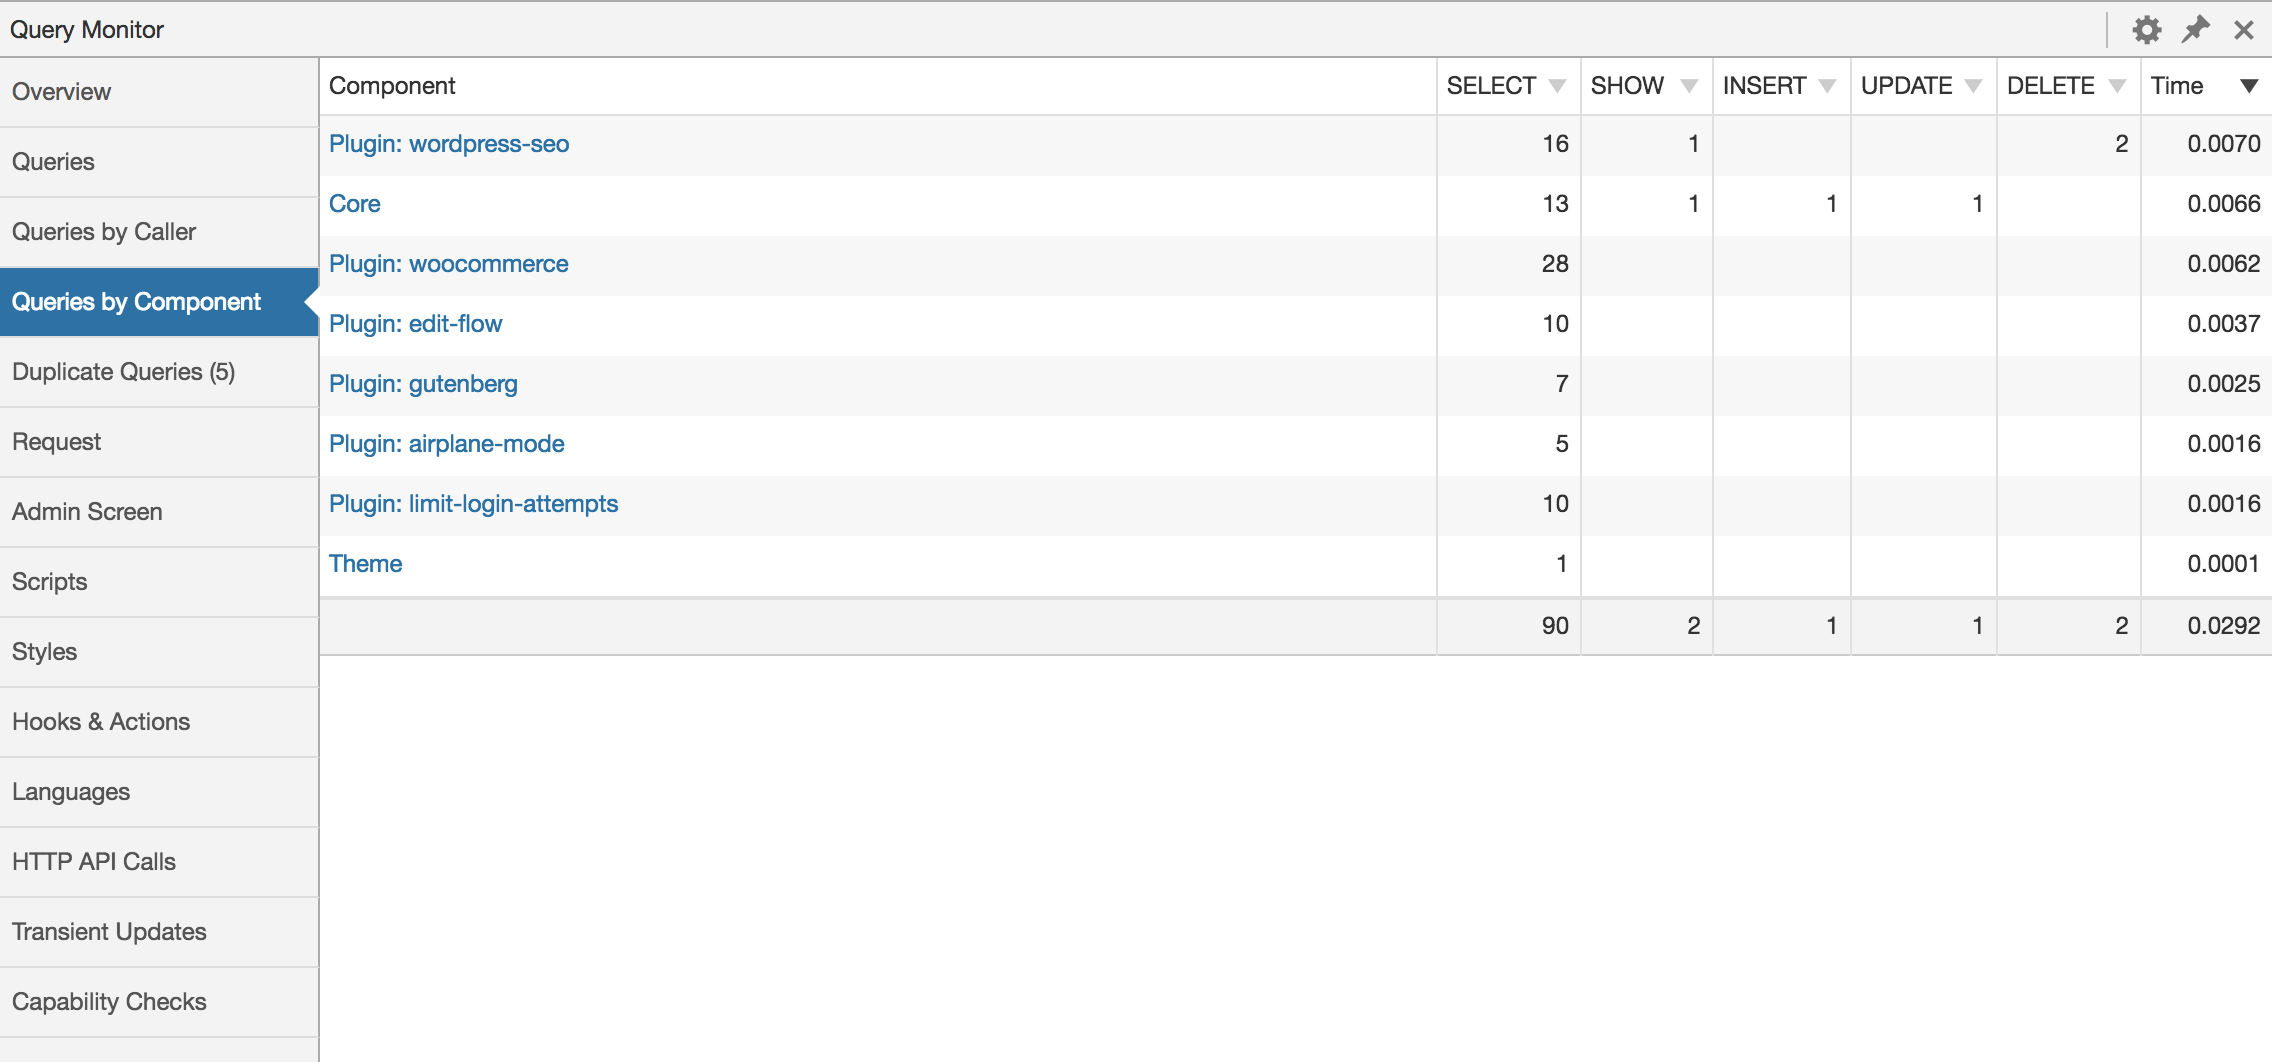
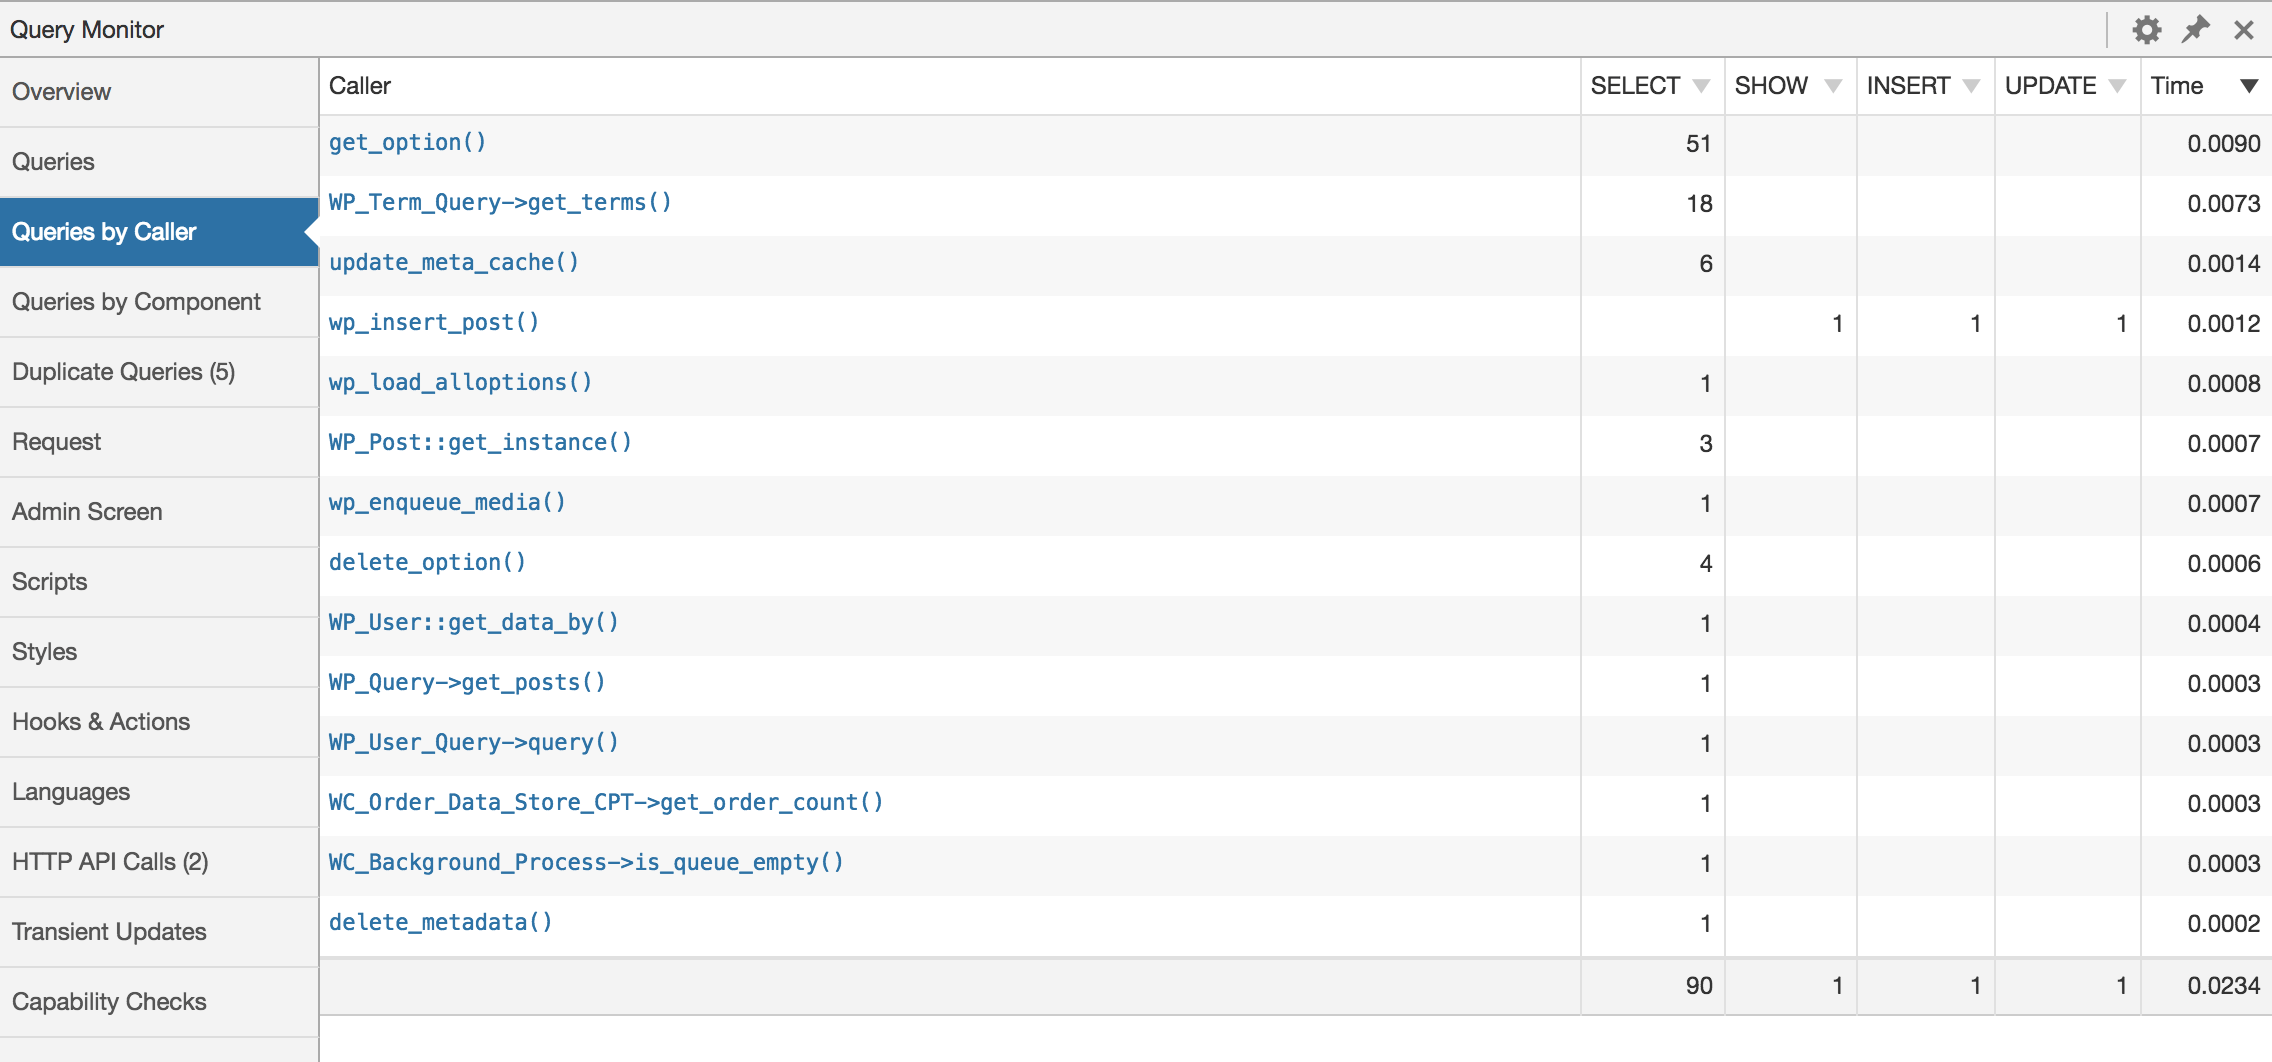
Query Monitor focuses heavily on presenting its information in a useful manner. Here's an example showing aggregate database queries grouped by the components responsible for them:
Features
Database Queries
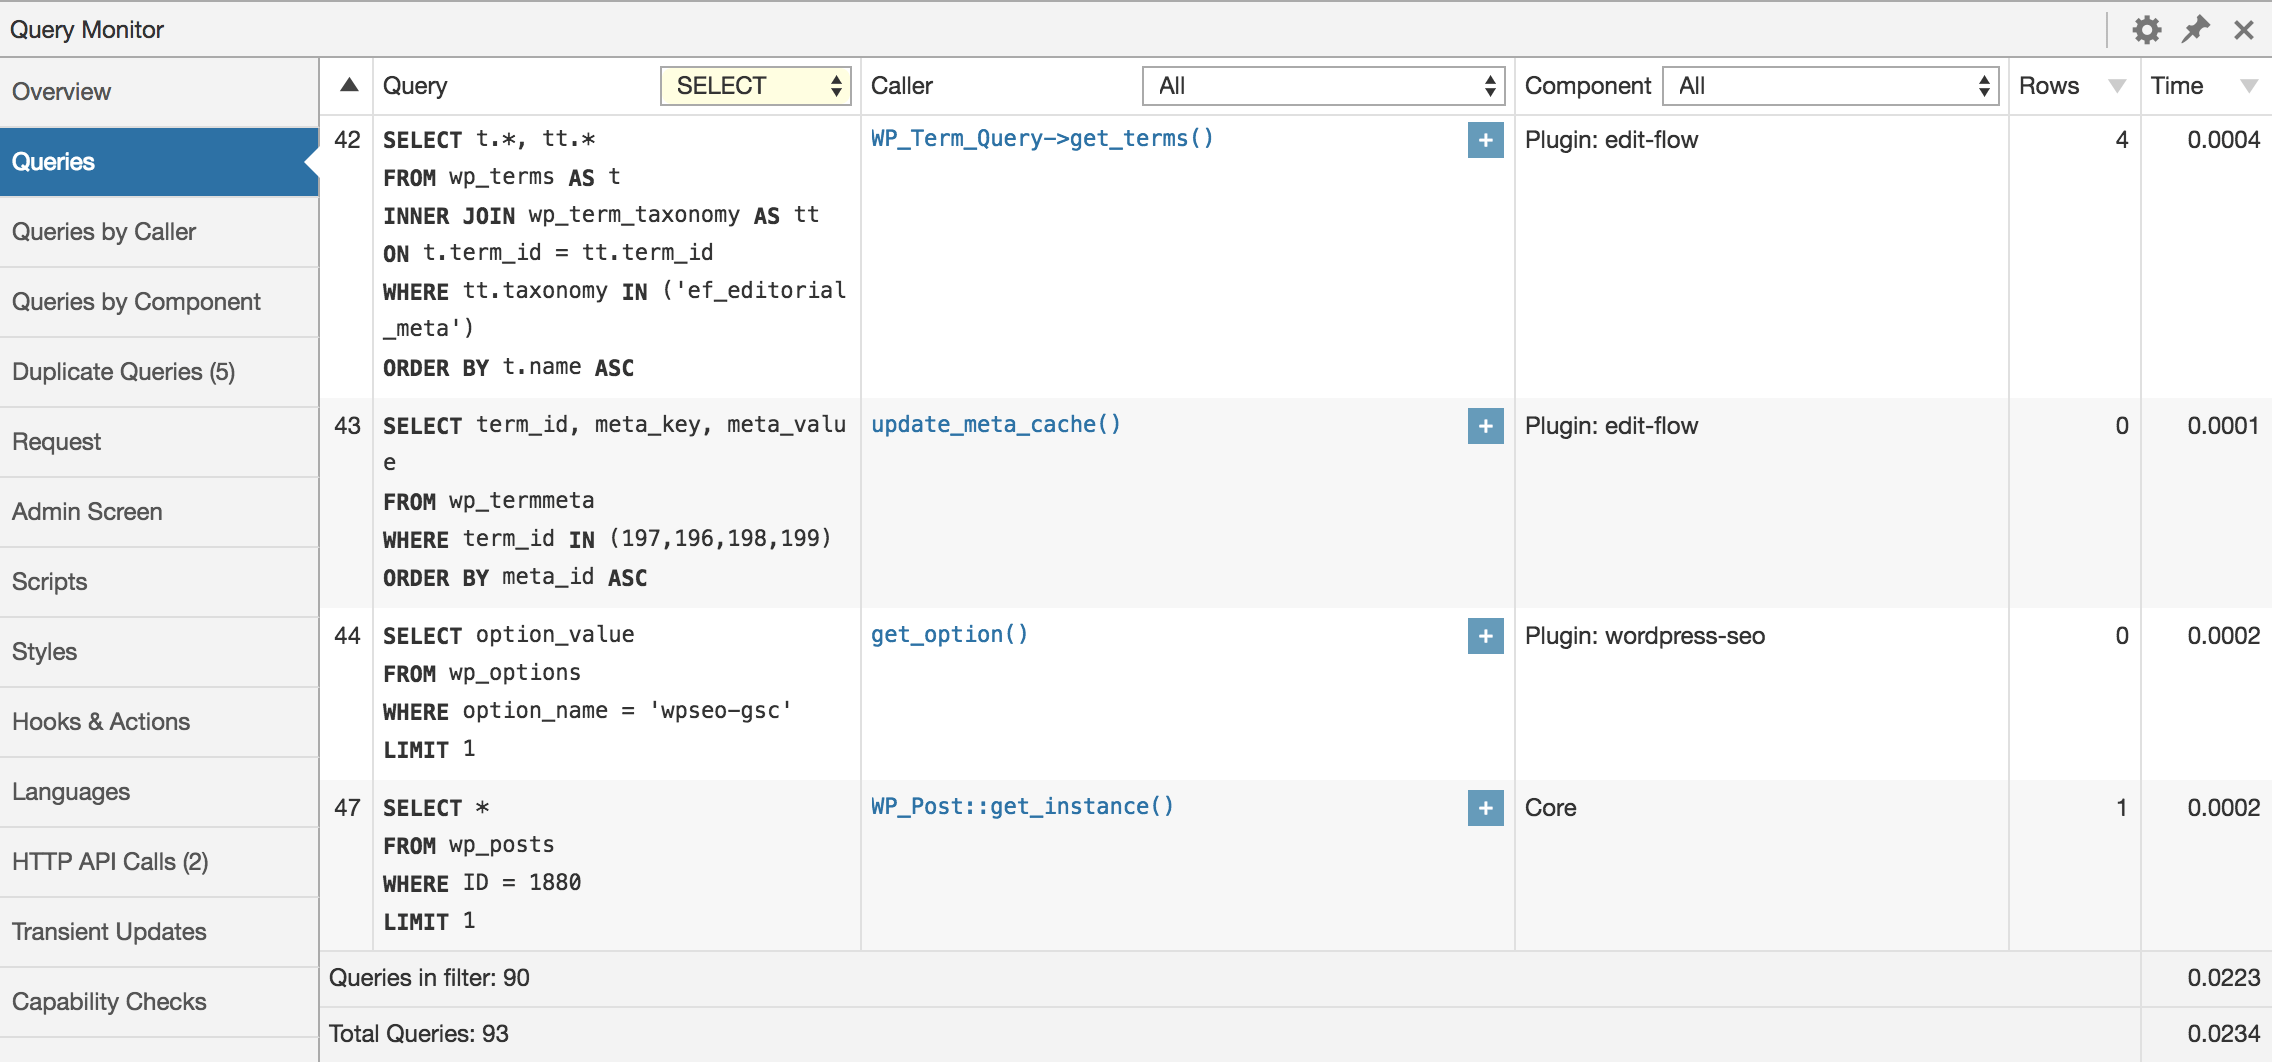
- Shows all database queries performed during the current request
- Shows affected rows and time taken for all queries
- Shows notifications for slow queries, duplicate queries, and queries with errors
- Shows aggregate query information grouped by type, component, or calling function
- Queries can be filtered by query type, component, or calling function
Filtering queries by component or calling function makes it easy to see which plugins, themes, or functions on your site are making the most (or the slowest) database queries.
Hooks & Actions
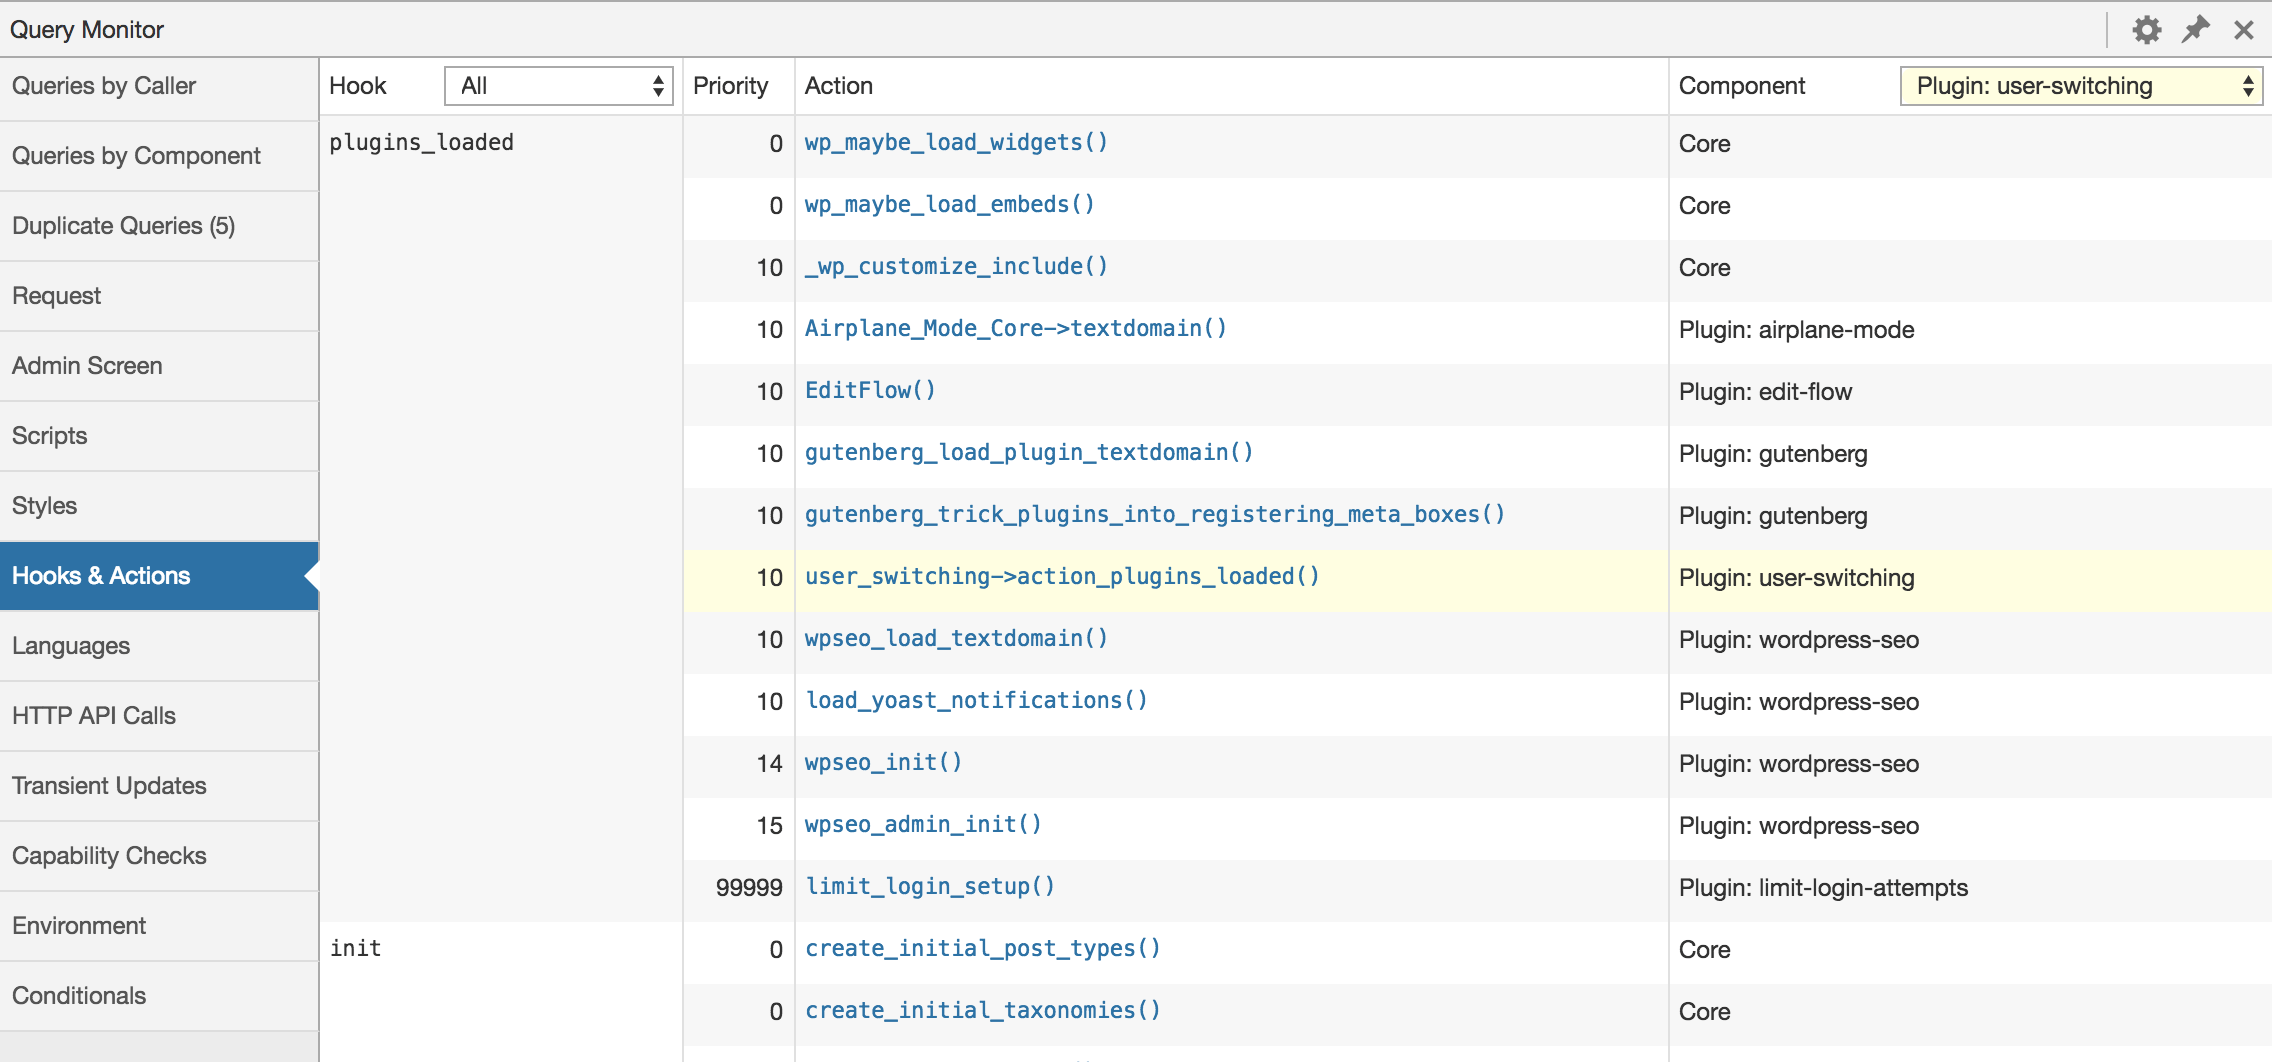
- Shows all hooks fired during the current request, along with action callbacks, priorities, and components
- Actions can be filtered by component or name
Theme
- Shows the template filename and complete template hierarchy
- Shows all template parts that were requested, and whether they were loaded or not
- Shows the available body classes
- Fully supports block themes and full site editing (FSE)
PHP Errors
- Shows PHP warnings, notices, stricts, and deprecated errors, formatted nicely along with their component and call stack
- Shows a visible warning in the admin toolbar when necessary
Doing it Wrong
- Shows usage of "Doing it Wrong" or "Deprecated" functionality in the code on your site
Block Content
- Shows blocks and associated information from post content and full site editing
Request
- Shows information about matched URL rewrite rules for the request and corresponding query parameters
- Shows query variables and highlights any that are custom
Scripts & Styles
- Shows all enqueued scripts and styles along with their handle, URL, and version
- Shows their dependencies and dependents
- Alerts you to any broken or missing dependencies
- Supports the script modules feature added in WordPress 6.5
Languages
- Shows you language settings and loaded text domains
- Shows you the requested MO, JSON, and PHP translation files for each text domain and which ones were loaded
HTTP API Requests
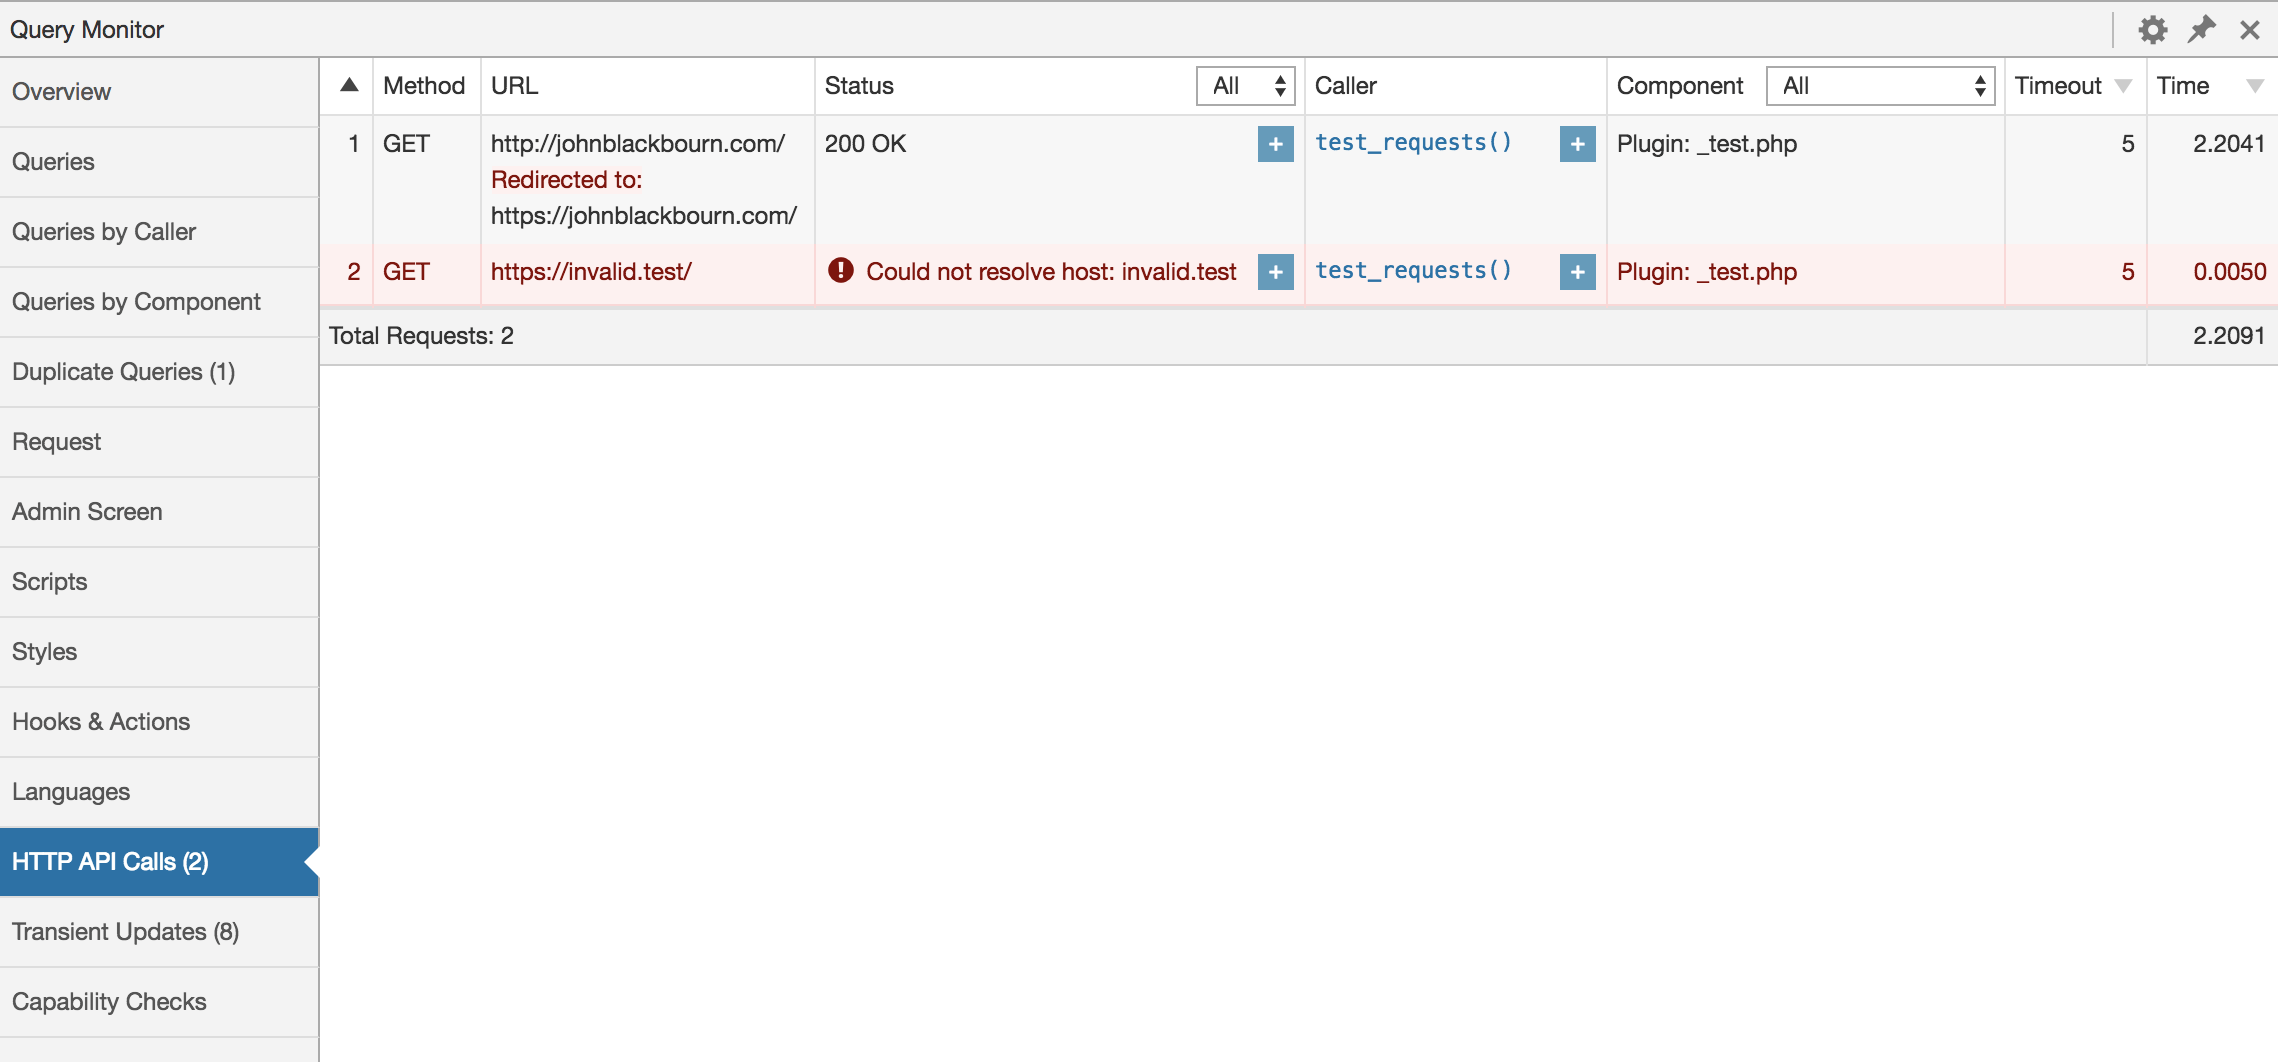
- Shows all server-side HTTP requests (as long as they use the WordPress HTTP API)
- Shows the response code, call stack, component, timeout, response size, time taken, and other meta data
- Alerts you to erroneous responses, such as failed requests and anything without a
200response code - Supports Guzzle HTTP requests via an optional middleware for comprehensive HTTP debugging
User Capability Checks
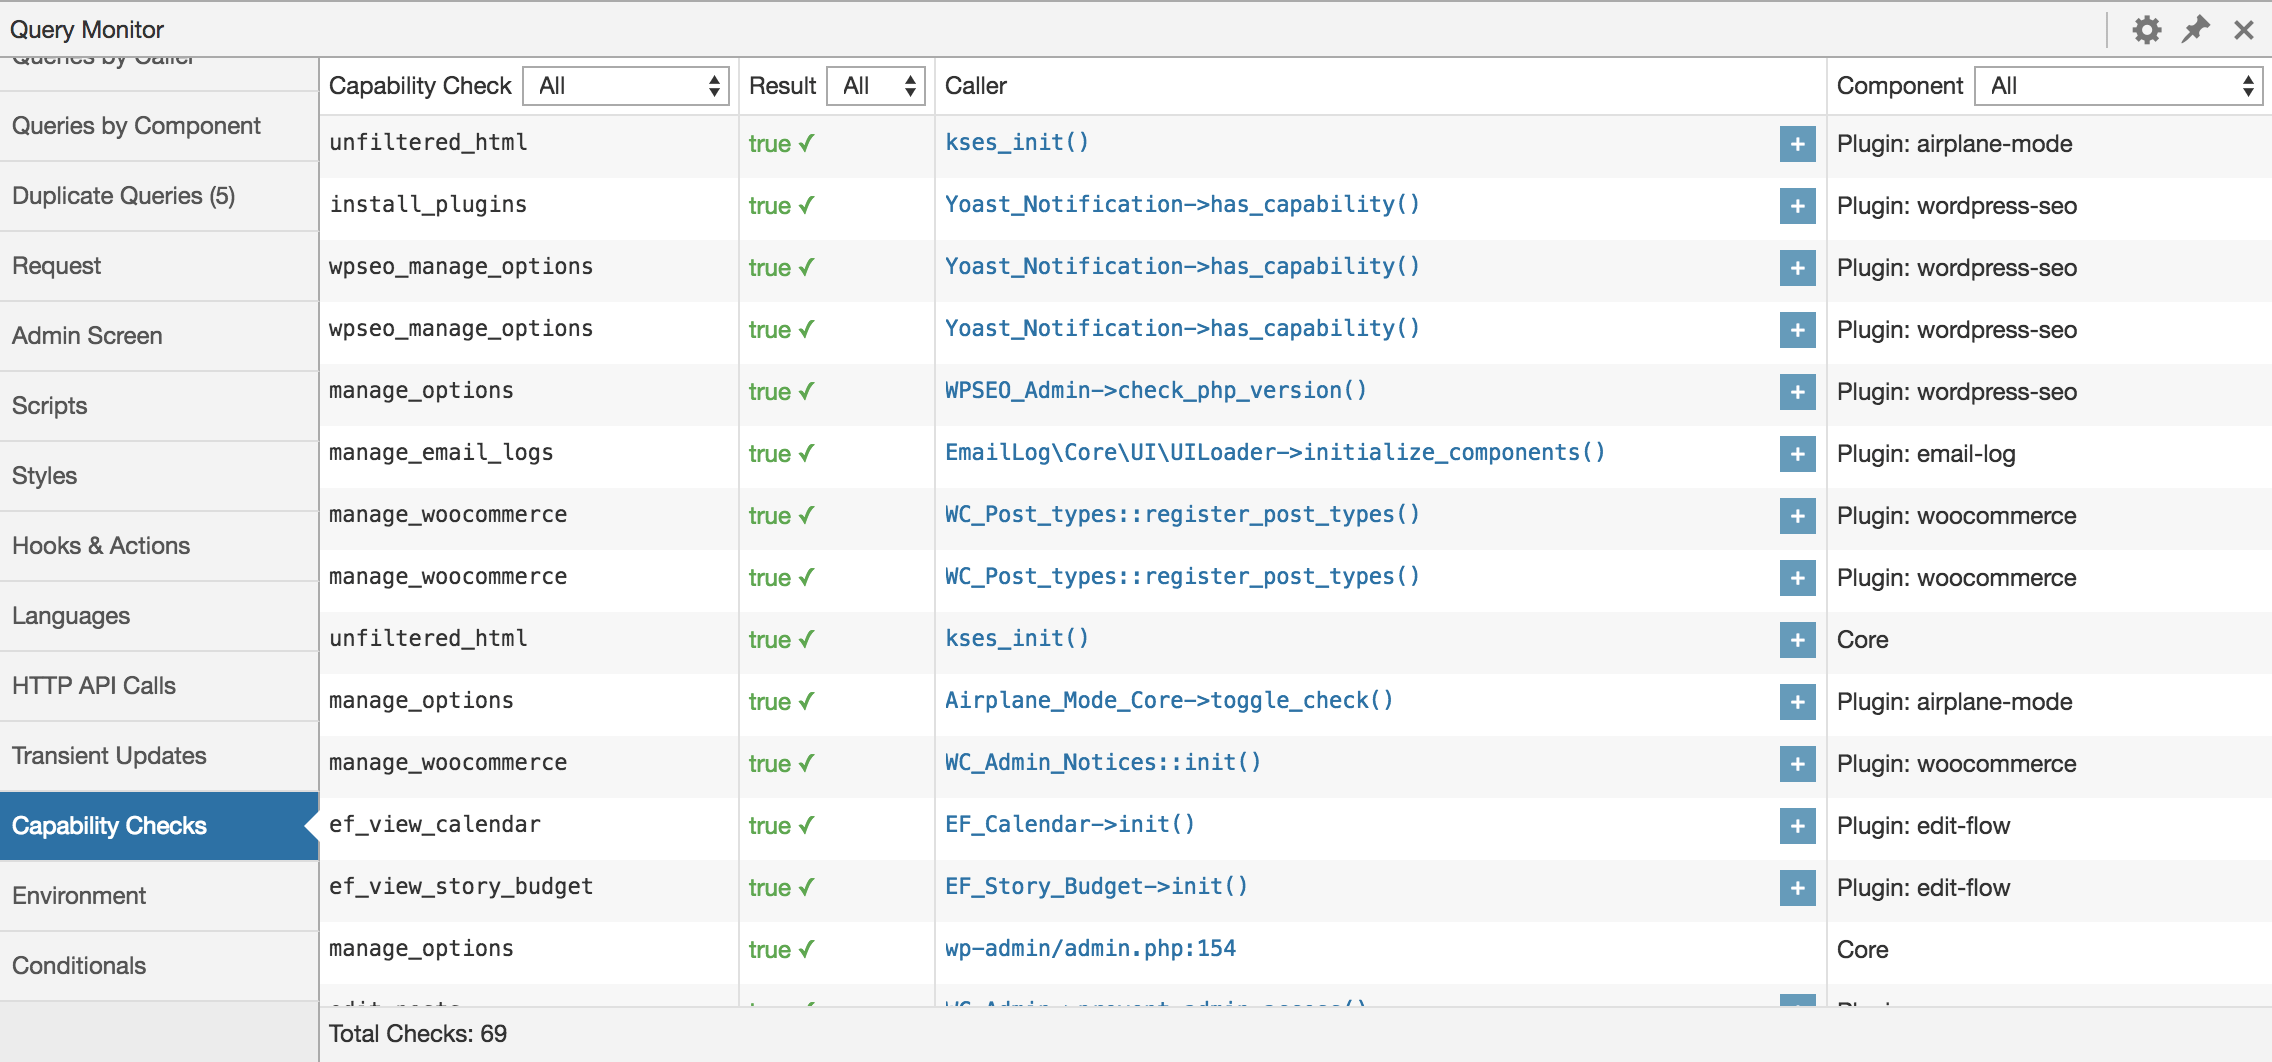
- Shows every user capability check that is performed, along with the result and any parameters passed along with the capability check
Multisite
- Shows all calls to
switch_to_blog()andrestore_current_blog()on Multisite installations
Redirects
- Whenever a server-side redirect occurs, Query Monitor adds an
X-QM-RedirectHTTP header containing the call stack, so you can use your favourite HTTP inspector or browser developer tools to trace where a redirect has come from
Ajax
The response from any jQuery Ajax request on the page will contain various debugging information in its headers. Any errors also get output to the developer console. No hooking required.
Currently this includes PHP errors and some overview information such as memory usage, but this will be built upon in future versions.
REST API
The response from an authenticated WordPress REST API request will contain various debugging information in its headers, as long as the authenticated user has permission to view Query Monitor's output.
Read more about debugging REST API requests with Query Monitor.
Admin Screen
- Shows the correct names for custom column filters and actions on all admin screens that use a list table
- Shows the state of
get_current_screen()and a few global variables
Environment Information
- Shows PHP information such as memory limit, error reporting levels, and values of various constants
- Shows MySQL or MariaDB information, including caching and performance related configuration
- Shows information about WordPress and the web server
- Shows version numbers for all the things
Logging
Debugging messages can be sent to the Logs panel using actions. This works as a good replacement for var_dump():
do_action( 'qm/debug', 'This happened!' );
The logger is PSR-3 compatible, so you can use any of the following actions which correspond to PSR-3 log levels:
qm/debugqm/infoqm/noticeqm/warningqm/errorqm/criticalqm/alertqm/emergency
A log level of warning or higher will trigger a notification in Query Monitor's admin toolbar.
Read more about profiling and logging in Query Monitor.
Profiling
Basic performance profiling can be displayed in the Timings panel using actions in your code:
// Start the 'foo' timer:
do_action( 'qm/start', 'foo' );

// Run some code
my_potentially_slow_function();

// Stop the 'foo' timer:
do_action( 'qm/stop', 'foo' );
Read more about profiling and logging in Query Monitor.
Guzzle HTTP Client Support
Query Monitor can log HTTP requests made with the popular Guzzle HTTP client library. This enables debugging of requests that bypass WordPress's HTTP API:
use GuzzleHttp\HandlerStack;
use GuzzleHttp\Client;

// Add Query Monitor middleware to your Guzzle client
$stack = HandlerStack::create();
$stack->push(QM_Collector_HTTP::guzzle_middleware());
$client = new Client(['handler' => $stack]);

// All requests will now appear in Query Monitor
$response = $client->get('https://api.example.com/data');
Guzzle requests will appear alongside WordPress HTTP API requests in the HTTP API Requests panel with full debugging information including timing, response codes, and stack traces.
Everything Else
- Shows any transients that were set, along with their timeout, component, and call stack
- Shows all WordPress conditionals during the current request, highlighted nicely
- Shows an overview at the top, including page generation time and memory limit as absolute values and as % of their respective limits
Authentication
By default, Query Monitor's output is only shown to Administrators on single-site installations, and Super Admins on Multisite installations.
In addition to this, you can set an authentication cookie which allows you to view Query Monitor output when you're not logged in, or when you're logged in as a user who cannot usually see Query Monitor's output. See the Settings panel for details.
Reviews
If you enjoy using Query Monitor I would greatly appreciate it if you left a positive review on the WordPress.org Plugin Directory.
Sponsors
The time that I spend maintaining this plugin and others is in part sponsored by:
Plus all my kind sponsors on GitHub:
Click here to find out about supporting my open source tools and plugins.
Notes
A Note on Query Monitor's Implementation
In order to do a few clever things, Query Monitor symlinks a custom db.php into your WP_CONTENT_DIR which means it loads very early. This file gets included before the database driver is loaded, meaning this portion of Query Monitor loads before WordPress even engages its brain.
In this file is Query Monitor's extension to the wpdb class which:
- Allows it to log details about all database queries (including ones that happen before plugins are loaded)
- Logs the full stack trace for each query, which allows it to determine the component that's responsible for the query
- Logs the query result, which allows it to display the affected rows or error message if applicable
If your WP_CONTENT_DIR isn't writable and therefore the symlink for db.php can't be put in place, Query Monitor still functions, but this extended functionality won't be available. You can manually create the db.php symlink if you have permission.
Screenshots
Aggregate Database Queries by Component
Database Queries
Timeline
Hooks and Actions
HTTP API Requests
Logs
Frequently Asked Questions
See the FAQ on the WordPress.org plugin page for Query Monitor.
Do you accept donations?
I am accepting sponsorships via the GitHub Sponsors program. If you work at an agency that develops with WordPress or WooCommerce, ask your company to provide sponsorship in order to invest in its supply chain. The tools that I maintain probably save your company time and money, and GitHub sponsorship can now be done at the organisation level.
In addition, if you like the plugin then I'd love for you to leave a review. Tell all your friends about it too!
Privacy Statement
Query Monitor is private by default and always will be. It does not persistently store any of the data that it collects. It does not send data to any third party, nor does it include any third party resources.
Query Monitor's full privacy statement can be found here.
Accessibility Statement
Query Monitor aims to be fully accessible to all of its users. It implements best practices for web accessibility, outputs semantic and structured markup, uses the accessibility APIs provided by WordPress and web browsers where appropriate, and is fully accessible via keyboard.
That said, Query Monitor does not conform to the Web Content Accessibility Guidelines (WCAG) 2.0 at level AA like WordPress itself does. The main issue is that the user interface uses small font sizes to maintain a high information density for sighted users. Users with poor vision or poor motor skills may struggle to view or interact with some areas of Query Monitor because of this. This is something which I'm acutely aware of and which I work to gradually improve, but the underlying issue of small font sizes remains.
If you've experienced or identified another accessibility issue in Query Monitor, please open a thread in the Query Monitor plugin support forum and I'll try my best to address it swiftly.
Related Tools
Debugging is rarely done with just one tool. Along with Query Monitor you should be aware of other plugins and tools for debugging and profiling your website. Here are some recommendations:
Plugins for WordPress
- Block Debug
- Block X-ray Attributes
- Code Profiler
- Debug This
- Decalog
- Laps
- Log HTTP Requests
- Rewrite Rules Inspector
- Snitch
- User Switching
- WP Crontrol
- WordPress Sentry
Query Monitor also has several add-on plugins which extend its functionality, and transparently supports add-ons for the Debug Bar plugin (see the FAQ for more info).
See also my list of Plugins for WordPress Developers.
Tools for WordPress developers
Other tools
Hosted services
Contributing
Code contributions, feedback, and feature suggestions are very welcome. See CONTRIBUTING.md for more details.
Icon
Query Monitor's icon was designed by Tubagus Didin Asrori.
License: GPLv2
This program is free software; you can redistribute it and/or modify it under the terms of the GNU General Public License as published by the Free Software Foundation; either version 2 of the License, or (at your option) any later version.
This program is distributed in the hope that it will be useful, but WITHOUT ANY WARRANTY; without even the implied warranty of MERCHANTABILITY or FITNESS FOR A PARTICULAR PURPOSE. See the GNU General Public License for more details.

