laraotel / opentelemetry-laravel
This package provides a simple way to use Telemetry From OpenTelemetry Otel to your Laravel application to Measure performance across jobs and services.
Package info
github.com/Mahmoud-Italy/laraotel-opentelemetry-laravel
pkg:composer/laraotel/opentelemetry-laravel
Fund package maintenance!
Requires
- php: >=8.2
- ext-opentelemetry: *
- open-telemetry/exporter-otlp: *
- open-telemetry/opentelemetry-auto-laravel: ^0.0.25
- open-telemetry/sdk: *
Requires (Dev)
- laravel/pint: ^1.15
- orchestra/testbench: ^9.0
- pestphp/pest: ^3.2
- pestphp/pest-plugin-laravel: ^3.0
- predis/predis: ^2.2
- spatie/invade: ^2.0
- spatie/test-time: ^1.3
- spatie/valuestore: ^1.3
- thecodingmachine/phpstan-safe-rule: ^1.2
README
This package provides a simple way to use Telemetry From OpenTelemetry OTel into your Laravel application to Measure performance across jobs and services, database queries, events etc..
Introduction
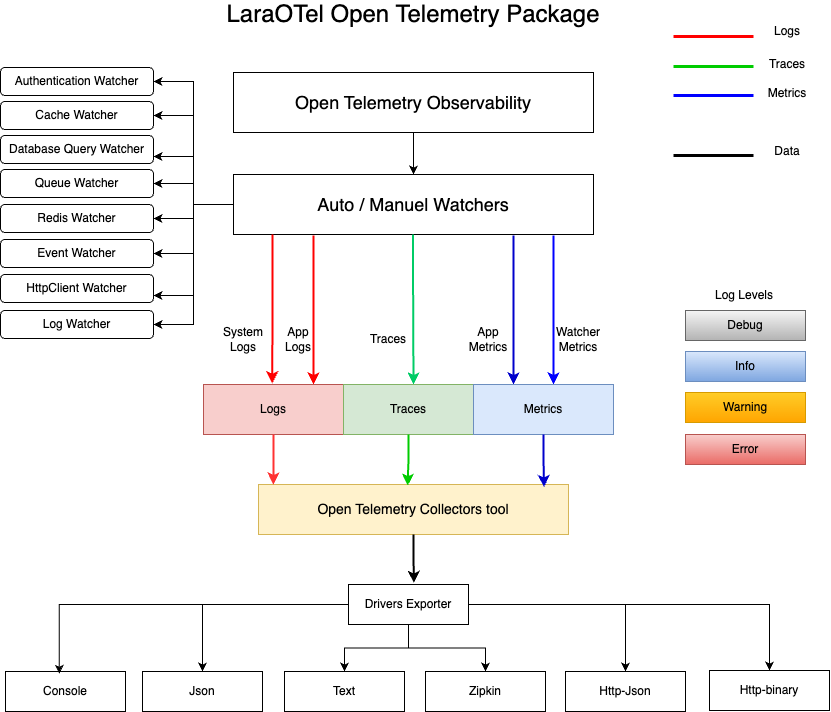
OpenTelemetry, or OTel for short, is an Observability tools designed to create and manage telemetry data such as traces, metrics and logs, to collect information on how your entire system is behaving.
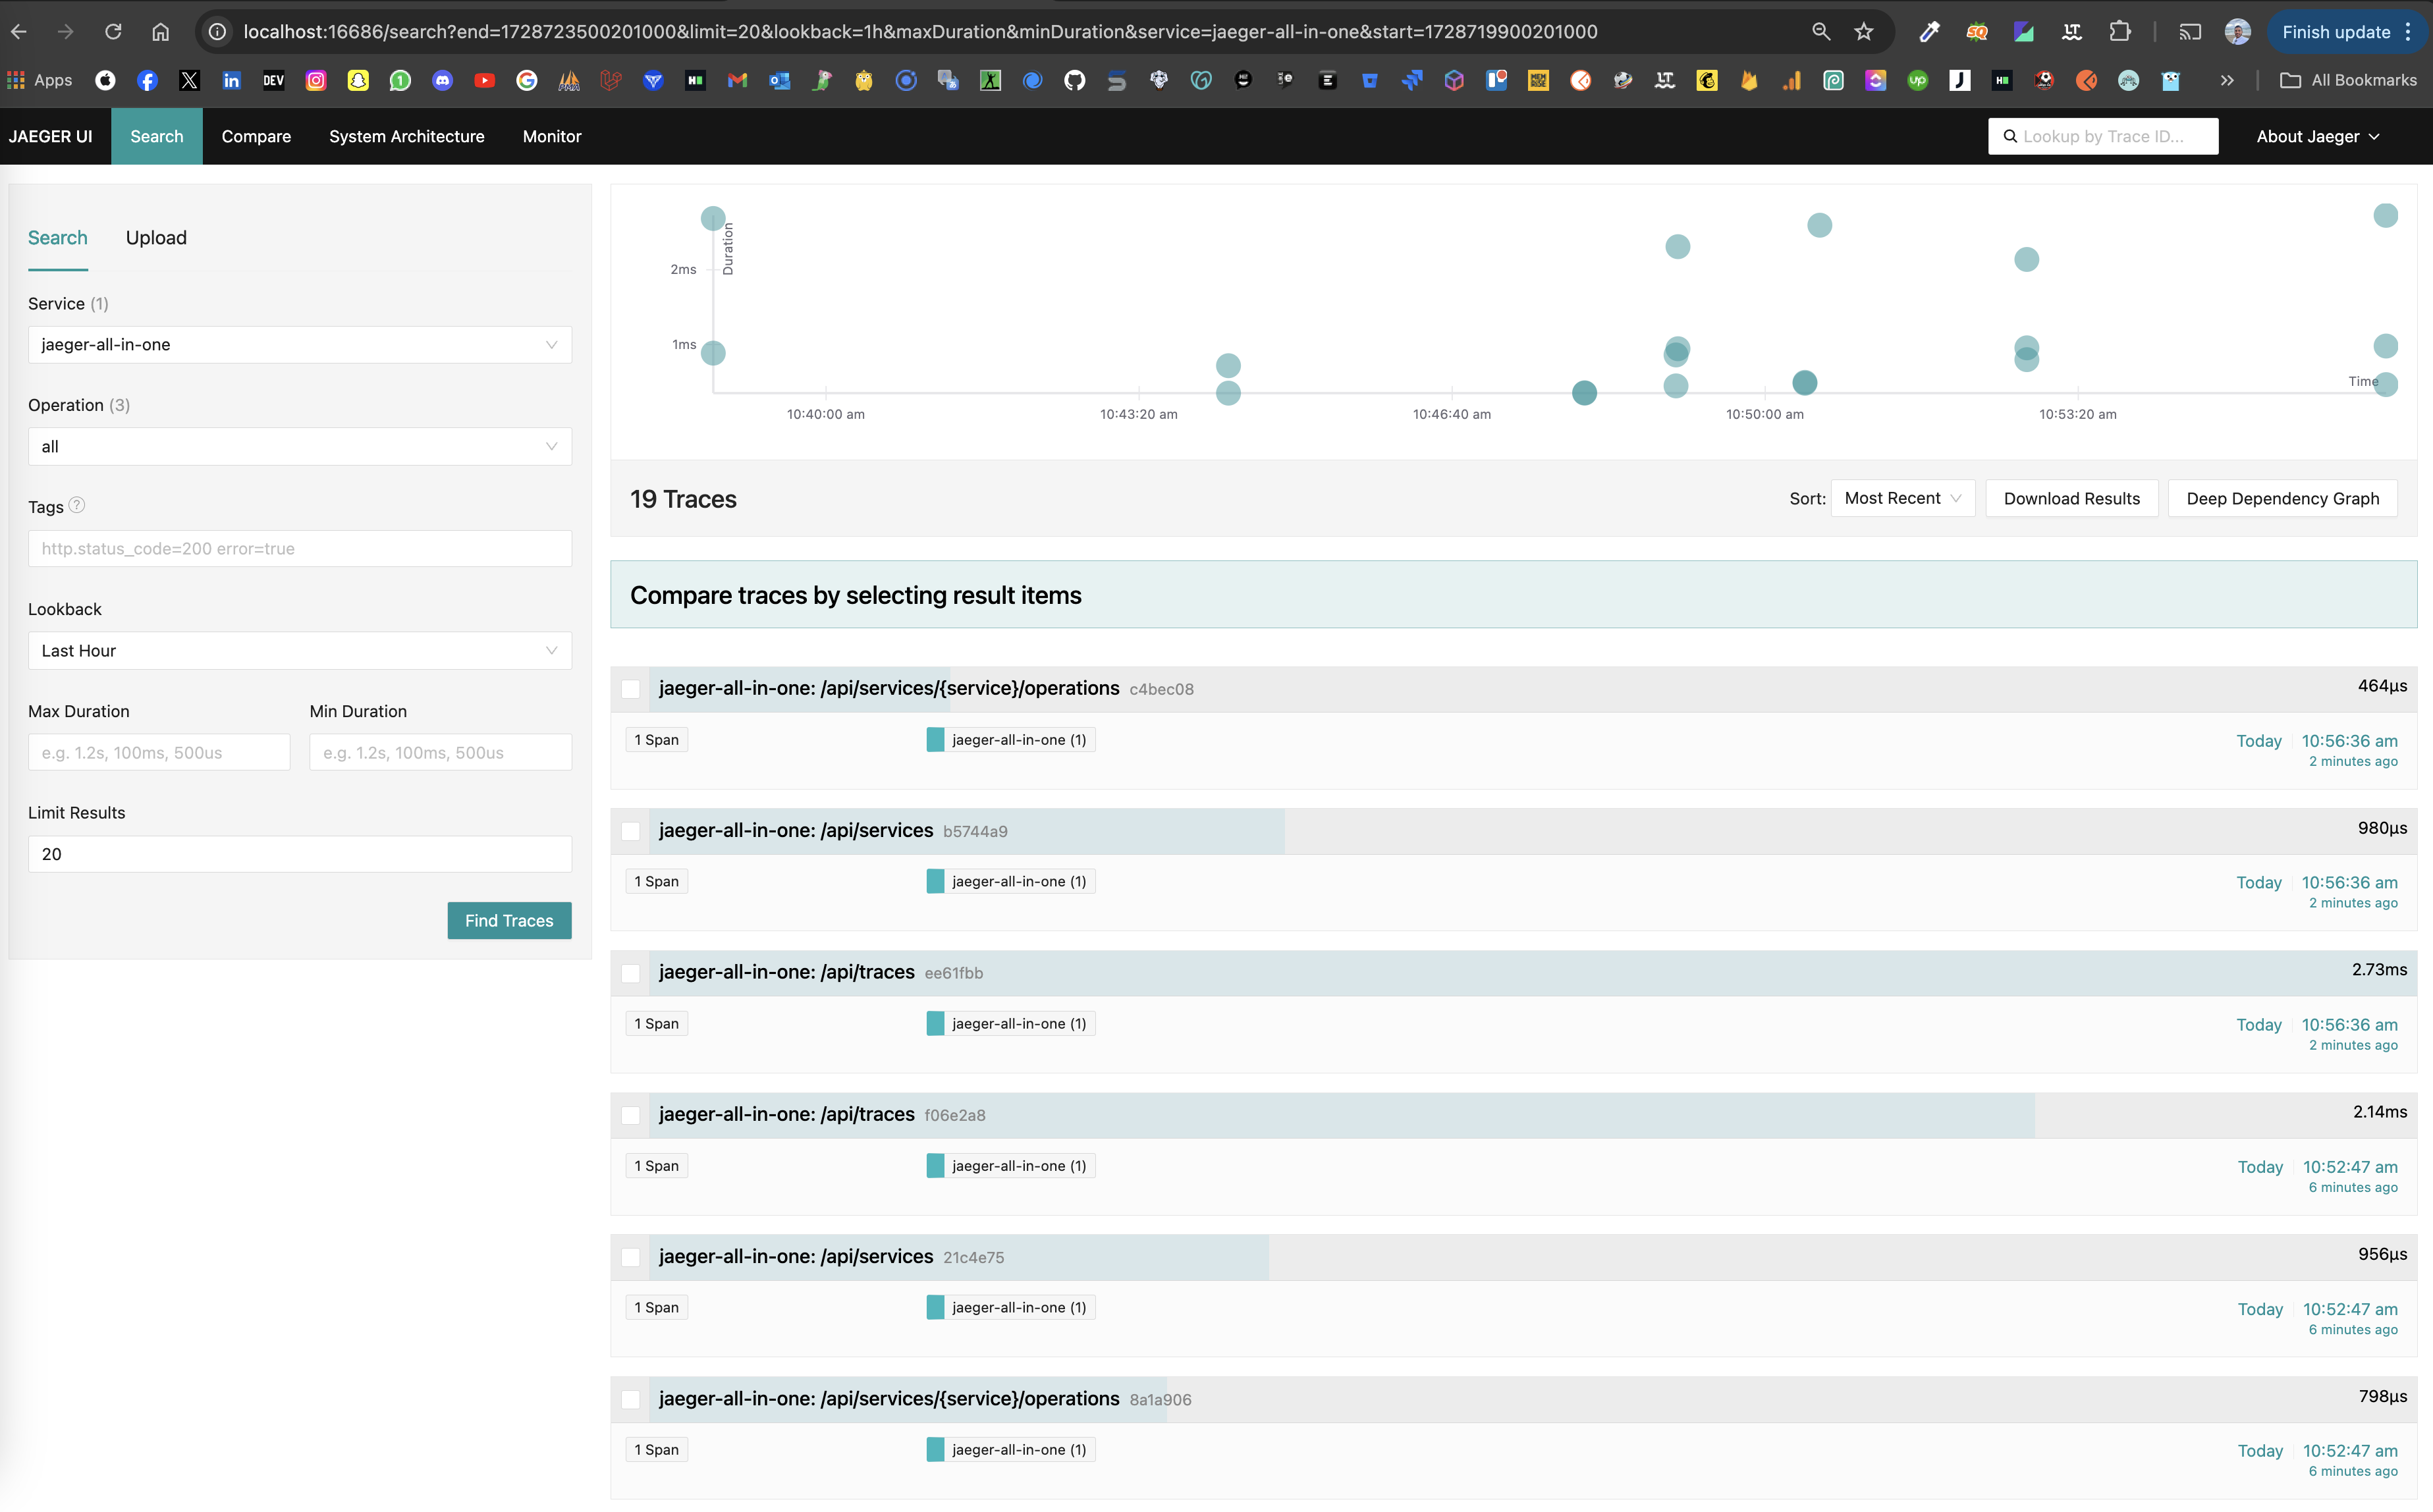
You can easily measure performance of a Laravel powered system. It can transmit the results to a tracing tool like Jaeger, Zipkin Or you can export data into Console, Json, text etc..
Bundle Zipkin and Jaeger into your Application
To visualize traces exported from our application, we need to integrate open source tracing tools Zipkin and Jaeger into our setup using docker.
First, we create a docker-compose.yaml file in the root of our project, with content as follows:
version: '3.7'
services:
    zipkin:
        image: openzipkin/zipkin-slim
        ports:
            - "9411:9411"
    jaeger:
        image: jaegertracing/all-in-one
        environment:
            COLLECTOR_ZIPKIN_HOST_PORT: 9412

        ports:
            - "9412:9412"
            - "16686:16686"
Next, we pull in Zipkin and Jaeger by running docker-compose up -d.
We can confirm that Zipkin is up by navigating to http://localhost:9411/ on our browser. For Jaeger, navigating
to http://localhost:16686/ on our browser should display the Jaeger home page.
Installation
You can install the package via composer:
composer require laraotel/opentelemetry-laravel:2.0.8
Important Note: The opentelemetry extension must be enabled on your machine.
Usage
Configuration
Publish the configuration file:
php artisan vendor:publish --provider="LaraOTel\OpenTelemetryLaravel\OpenTelemetryServiceProvider" --tag="config"
Update the environment variables
You can find them in configuration file: config/otel.php.
Register the middleware
you can register the middleware in the app/Http/Kernel.php:
protected $middleware = [
    \LaraOTel\OpenTelemetryLaravel\Middlewares\MeasureRequest::class,
    // ...
];
In laravel 11 you can not register in the kernel.php the middlewares anymore. You can register your global middleware in bootstrap/app.php
->withMiddleware(function (Middleware $middleware) {
    $middleware->append(\LaraOTel\OpenTelemetryLaravel\Middlewares\MeasureRequest::class);
})
or you can set the env variable OTEL_AUTO_TRACE_REQUESTS to true to enable it automatically.
Watchers
This package provides some watchers to help you trace your application:
LaraOTel\OpenTelemetryLaravel\Watchers\AuthenticateWatcherto trace authentications.LaraOTel\OpenTelemetryLaravel\Watchers\CacheWatcherto trace cache operations.LaraOTel\OpenTelemetryLaravel\Watchers\DatabaseQueryWatcherto trace database queries.LaraOTel\OpenTelemetryLaravel\Watchers\QueueWatcherto trace job execution.LaraOTel\OpenTelemetryLaravel\Watchers\RedisWatcherto trace redis operations.LaraOTel\OpenTelemetryLaravel\Watchers\EventWatcherto trace event opearations.LaraOTel\OpenTelemetryLaravel\Watchers\HttpClientWatcherto trace http client requests.LaraOTel\OpenTelemetryLaravel\Watchers\LogWatcherto trace log operations.
You can enable or disable them in the configuration file: config/otel.php.
Custom span
You can create a custom span by using the LaraOTel\OpenTelemetryLaravel\Facades\Measure facade:
use LaraOTel\OpenTelemetryLaravel\Facades\Measure;

Measure::span('my-web-request')->measure(function() {
    // ...
});
or manually start and end a span:
Measure::start('my-web-request');

// ...

Measure::end();
and you can modify the span attributes by using a closure:
Measure::start('my-web-request', function($span) {
    $span->setAttribute('key', 'value');
    // ...
});

// ...
Measure::end();
of course, you can get the span instance by using the Measure::span() method:
$span = Measure::span('my-web-request');
$span->setAttribute('key', 'value');
$scope = $span->activate();

// ...

$span->end();
$scope->detach();
Available Drivers
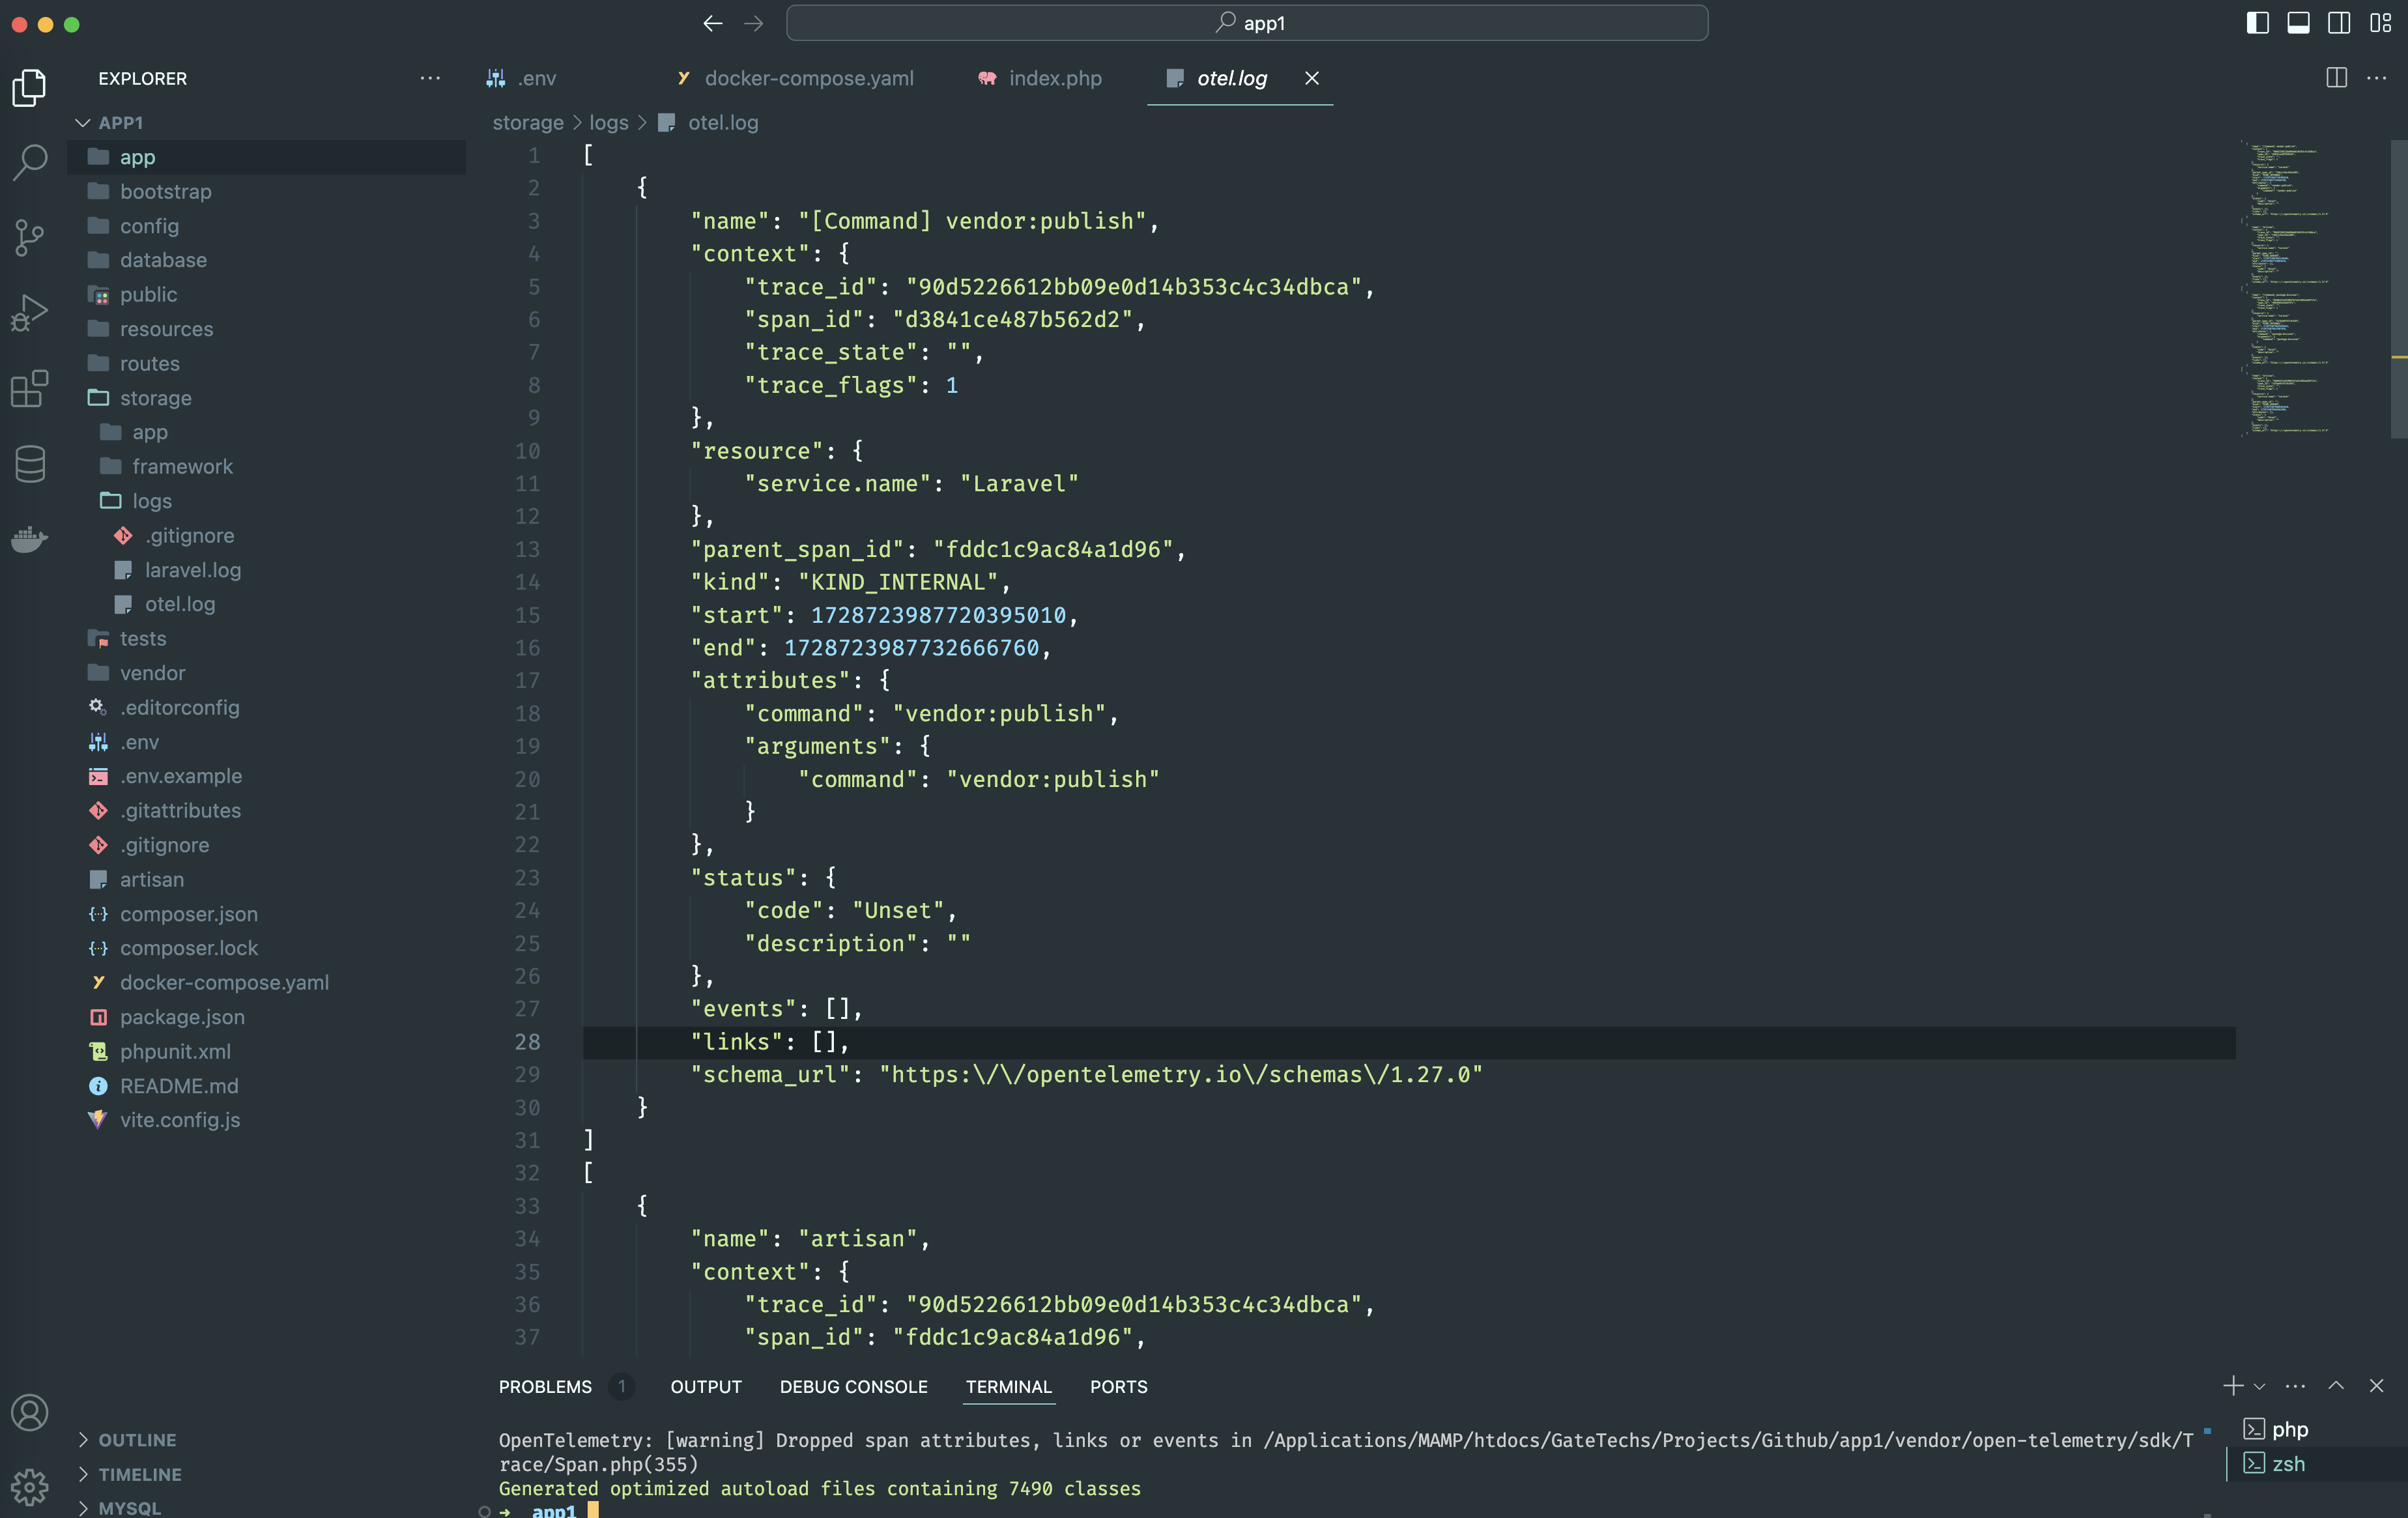
'default' => env('OTEL_DEFAULT_TRACER', 'log'),

# available drivers: `console`, `log`, `text`, `zipkin`, `http-json`, `http-binary`, `grpc`.
'tracers' => [
    'console' => [
        'driver' => 'console',
        'transport' => 'stream',
        'span_exporter' => 'console',
    ],

    'log' => [
        'driver' => 'log',
        'transport' => 'stream',
        'span_exporter' => 'console',
        'endpoint' => storage_path('logs/otel.log'),
    ],

    'text' => [
        'driver' => 'text',
        'transport' => 'stream',
        'endpoint' => storage_path('logs/otel.text'),
    ],

    'zipkin' => [
        'driver' => 'zipkin',
        'transport' => 'http',
        'span_exporter' => 'otlp',
        'endpoint' => env('OTEL_EXPORTER_ZIPKIN_ENDPOINT', 'http://zipkin:9411/api/v2/spans'),
        'content_type' => 'application/json',
    ],

    'http-json' => [
        'driver' => 'http-json',
        'transport' => 'http',
        'span_exporter' => 'otlp',
        'endpoint' => env('OTEL_HTTP_JSON_ENDPOINT', 'http://localhost:9411/v1/traces'),
        'content_type' => 'application/json',
    ],

    'http-binary' => [
        'driver' => 'http-binary',
        'transport' => 'http',
        'span_exporter' => 'otlp',
        'endpoint' => env('OTEL_HTTP_BINARY_ENDPOINT', 'http://localhost:4318/v1/traces'),
        'content_type' => 'application/x-protobuf',
    ],
],
Available Logs Level
use LaraOTel\OpenTelemetryLaravel\Facades\Logger;

Logger::debug('my log message');
Logger::info('my log message');
Logger::warning('my log message');
Logger::error('my log message');
UML Diagram of the package design
Testing
composer test
License
The MIT License (MIT). Please see License File for more information.

