
halilcosdu / laravel-slower

Laravel Slower: Optimize Your DB Queries with AI
Fund package maintenance!
Requires
- php: ^8.3
- illuminate/contracts: ^11.0 || ^12.0 || ^13.0
- prism-php/prism: ^0.100.1
- spatie/laravel-package-tools: ^1.16
Requires (Dev)
- larastan/larastan: ^3.0
- laravel/pint: ^1.18
- nunomaduro/collision: ^8.6 || ^9.0
- orchestra/testbench: ^9.0 || ^10.0 || ^11.0
- pestphp/pest: ^4.0
- pestphp/pest-plugin-arch: ^3.0 || ^4.0
- pestphp/pest-plugin-laravel: ^4.0
- phpstan/extension-installer: ^1.4
- phpstan/phpstan: ^2.0
- phpstan/phpstan-deprecation-rules: ^2.0
- phpstan/phpstan-phpunit: ^2.0
- spatie/laravel-ray: ^1.35
Suggests
None
Provides
None
Conflicts
None
Replaces
None
- dev-main
- v3.2.0
- v3.1.1
- v3.1.0
- v3.0.0
- v2.3.0
- v2.2.0
- v2.1.0
- v2.0.5
- v2.0.4
- v2.0.3
- v2.0.2
- v2.0.1
- v2.0.0.x-dev
- v2.0.0
- v1.1.1
- v1.1.0
- v1.0.9
- v1.0.8
- v1.0.7
- v1.0.6
- v1.0.5
- v1.0.4
- v1.0.3
- v1.0.2
- v1.0.1
- v1.0.0
- dev-claude/add-comprehensive-tests-011CUqCep7sjHZV9MP8q4xaC
- dev-claude/fix-laravel-12-compatibility-011CUqCep7sjHZV9MP8q4xaC
- dev-claude/add-laravel-12-support-011CUqCep7sjHZV9MP8q4xaC
This package is auto-updated.
Last update: 2026-10-04 20:32:26 UTC
README
Laravel Slower
Find your slowest database queries — and let AI tell you how to fix them.
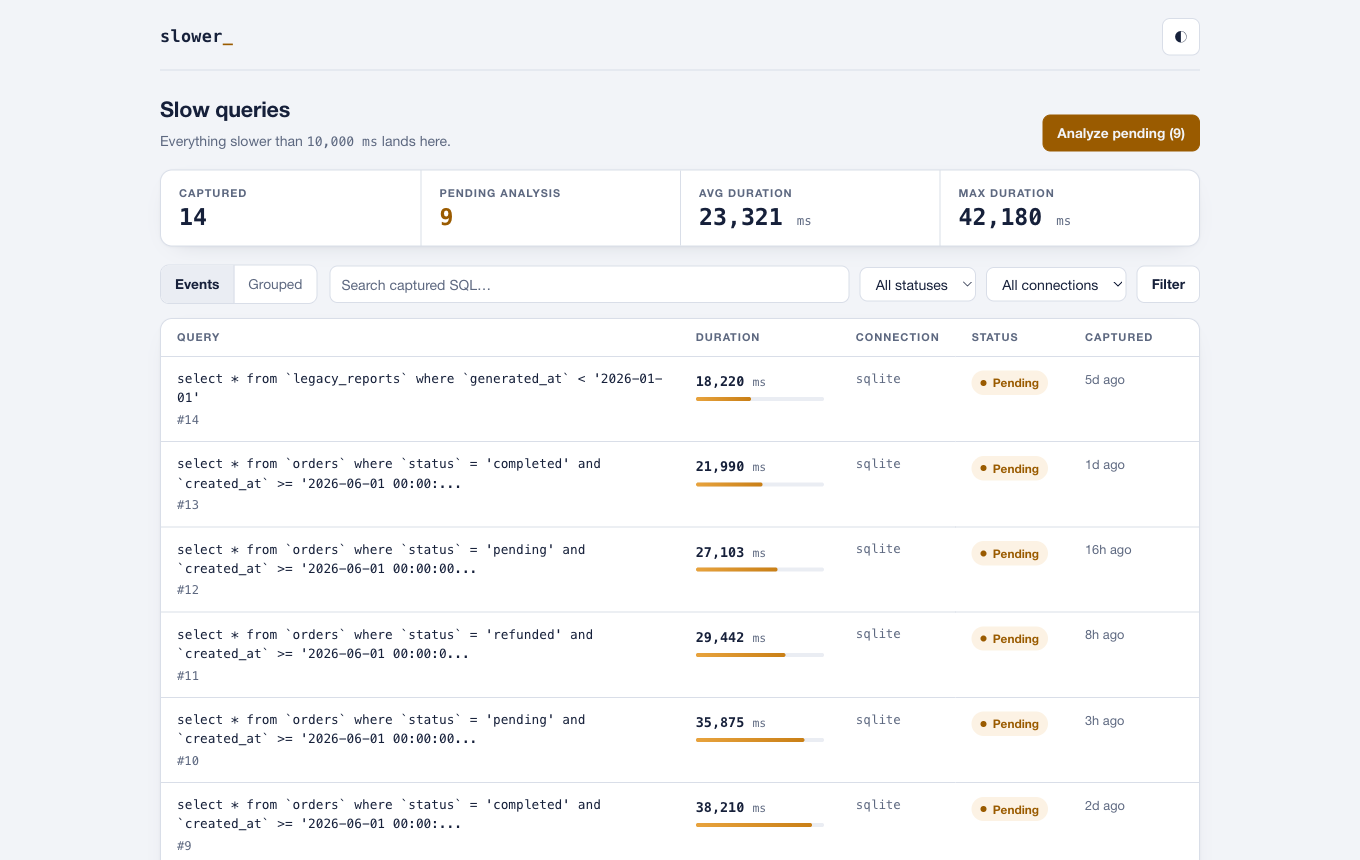
Laravel Slower watches every query your application runs, captures the ones that cross your threshold, and uses AI to recommend indexes and query rewrites. It speaks to every major LLM — OpenAI, Anthropic (Claude), Google Gemini, or any custom/self-hosted model — through one official package. And since v2.3 it ships with a built-in dashboard: install the package and you have a full slow-query UI at /slower, with zero frontend work — no npm, no CDN, no assets to publish.
Contents
- Features
- How it works
- Requirements
- Installation
- The Dashboard
- Query groups
- Origin context
- Production controls
- Privacy: what reaches your AI provider
- Queued analysis
- Events
- Configuration
- AI providers
- Commands and scheduling
- Programmatic usage
- Development and testing
Features
- 🚨 Automatic capture — a
DB::listenhook logs every query slower than your threshold, with bindings and resolved SQL. - 🧬 Query groups — every capture gets a fingerprint, so 10,000 repeats of the same statement read as one problem with a counter, not ten thousand rows.
- 📍 Origin context — each capture records where it came from: the route and controller action, queue job, or artisan command, down to the
file:lineof your code that triggered it. - 🤖 AI recommendations — sends the query shape, schema, indexes, origin and a safe
EXPLAINplan to your LLM of choice (OpenAI, Anthropic, Gemini, or a custom driver) and stores actionable optimization advice. - 🔒 Privacy-first AI payload — by default only the parameterized SQL leaves your app: no binding values, no literals. Raw SQL and bindings are explicit opt-ins with a redactor hook.
- 🧩 Any major LLM, one variable — switch providers with
SLOWER_AI_SERVICE; credentials live in Prism's config, not Slower's. Bring your own model with a one-method driver. - 📊 Built-in dashboard — stats, events & grouped views, search, filters, sorting, query detail with rendered recommendations, one-click Analyze with AI, cleanup tools. Dark and light theme, fully self-contained.
- 🎚️ Production controls — sampling, a per-request capture cap, and a circuit breaker that backs off when storing logs fails. Safe to leave on under real traffic.
- 🧵 Queued analysis — run AI analysis as unique background jobs (
SLOWER_ANALYZE_QUEUE) so a 30-second LLM round-trip never blocks a request. - 📣 Events, not lock-in —
SlowQueryCapturedandSlowQueryFirstSeenevents let you wire alerts to Slack, mail or anything else in a few lines. - 🛡️ Safe by default — the dashboard is only accessible in the
localenvironment until you explicitly open it, AI actions are rate-limited and capped, destructive actions ask first. - ⏰ Scheduler-friendly commands —
slower:analyze,slower:cleanandslower:fingerprintfor bulk analysis, retention and upgrades.
How it works
every query → DB::listen (timed) → slower than threshold → slow_logs → AI analysis → recommendation → /slower
- Capture. A
DB::listenhook times every query. Anything slower thanthreshold(ms) is written to theslow_logstable with its SQL, bindings, connection, a fingerprint (so repeats group together) and its origin (route/job/command + code location). Faster queries are ignored — nothing is stored. - Analyze.
slower:analyze(or the dashboard's Analyze with AI button, or a queued job) sends each unanalyzed query — the parameterized SQL, table schema, indexes, origin and a safe, read-onlyEXPLAINplan — to your configured LLM (OpenAI, Claude, Gemini or a custom driver). - Recommend. The advice (indexes, rewrites, data-type fixes) is stored on the record and rendered as markdown in the dashboard, ready to act on.
Requirements
- PHP 8.3+
- Laravel 11.x, 12.x or 13.x
Installation
composer require halilcosdu/laravel-slower

php artisan vendor:publish --tag="slower-migrations"
php artisan migrate
That's it — in your local environment, open /slower and every captured slow query is waiting for you.
Optionally publish the config file:
php artisan vendor:publish --tag="slower-config"
To enable AI recommendations, pick a provider and set its API key.
The Dashboard

The dashboard lives at /slower and gives you:
- Overview stats — captured count, pending analysis, average and max duration.
- Two list modes — Events (every capture) and Grouped (one row per query shape with an occurrence counter, avg/max duration and last-seen time). Click a group to drill into its events.
- Search and filters — search over the resolved SQL, status and connection filters, sortable columns, pagination — in both modes.
- Query detail — formatted SQL, parameterized statement, bindings, the origin (route/job/command and code location), and the AI recommendation rendered from markdown.
- Actions — Analyze with AI per query (or up to
analyze_pending_limitpending queries at once), delete, and clean up older than N days (0wipes everything). Every AI action warns that it may incur provider charges; every destructive action asks for confirmation.
Authorizing access in production
Exactly like Telescope and Horizon, the dashboard is protected by a gate. By default it only allows access in the local environment. To open it up in other environments, define a viewSlower gate — for example in AppServiceProvider:
use Illuminate\Support\Facades\Gate;

Gate::define('viewSlower', function ($user = null) {
    return $user?->email === 'you@example.com';
});
Dashboard configuration
'dashboard' => [
    'enabled' => env('SLOWER_DASHBOARD_ENABLED', true),
    'path' => env('SLOWER_DASHBOARD_PATH', 'slower'),
    'domain' => env('SLOWER_DASHBOARD_DOMAIN'),
    'middleware' => [
        'web',
        HalilCosdu\Slower\Http\Middleware\Authorize::class,
    ],
    'per_page' => 25,
    'analyze_pending_limit' => 10,
],
Set SLOWER_DASHBOARD_ENABLED=false to remove the routes entirely, or change path to serve it elsewhere. Want to restyle it? php artisan vendor:publish --tag="laravel-slower-views".
Warning
Captured SQL and bindings can contain user data, tokens and other secrets, and analyzing a query sends it (with schema context) to your AI provider as a billable API call. Keep the gate tight, and prune regularly with slower:clean.
Query groups
The same slow query rarely fires once. Every capture is fingerprinted — literals, whitespace, placeholder style and IN (...) list sizes are normalized away — so these three executions:
select * from orders where status = 'pending'  and created_at >= '2026-06-01'
select * from orders where status = 'refunded' and created_at >= '2026-07-01'
SELECT * FROM orders WHERE status = ? AND created_at >= ?
are one group in the dashboard's Grouped view, with an occurrence counter, average/max duration, and last-seen time — so you fix the most frequent offender first instead of scrolling through repeats. Groups are scoped per connection, and clicking one drills down to its individual events.

Fingerprints are computed from the parameterized SQL (never from real values) and the algorithm is versioned. Upgrading from an earlier version? Fingerprint your existing records once:
php artisan slower:fingerprint # chunked & idempotent — safe to interrupt and re-run
Origin context
"Which query is slow" is only half the answer — where it comes from is the half you can act on. Each capture records its origin automatically:
| Execution | What gets recorded |
|---|---|
| HTTP request | route name, URI pattern, Controller@action |
| Queue job | the job class |
| Artisan command | the command name |
| All of the above | the first file:line of your application code in the stack |
The origin is shown on the query detail page and included in the AI prompt — which turns generic advice into "add ->with('items') to the query in OrderController@index".
Two privacy notes, both deliberate defaults:
SLOWER_CAPTURE_ORIGIN=true    # set false to skip origin capture entirely
SLOWER_CAPTURE_USER_ID=false  # opt in to also record the authenticated user id
The backtrace is taken only for queries that already crossed the threshold (so there is no per-query overhead), with DEBUG_BACKTRACE_IGNORE_ARGS — argument values never enter the trace.
Production controls
Designed to be left on under real traffic:
SLOWER_SAMPLE_RATE=1.0        # capture this fraction of threshold-exceeding queries (0.0–1.0)
SLOWER_MAX_PER_EXECUTION=50   # hard cap per request / job / command run
- Sampling — on very high-traffic apps, capture a representative fraction instead of every slow query. Counts become approximate; your database stays calm.
- Per-execution cap — one runaway request or job can produce hundreds of slow queries; the cap stops it from flooding the log table.
- Circuit breaker — if storing a capture itself fails (full disk, dropped table), Slower backs off for 60 seconds instead of adding a failed INSERT to every slow query in the process. Failures are still
report()ed. - Self-capture guard — queries touching Slower's own table are never captured, so the logger cannot feed itself.
Privacy: what reaches your AI provider
The AI payload is safe by default — this is the exact contract:
| Payload part | Sent by default? | Contains |
|---|---|---|
Parameterized SQL (... where id = ?) |
✅ yes | query shape, no values |
| Schema & indexes of referenced tables | ✅ yes | column names/types, index definitions |
| Origin context | ✅ yes (when captured) | route/job/command, code location — a captured user id is never forwarded |
EXPLAIN output |
✅ yes (configurable) | the plan — may echo literal values on some drivers |
| Raw SQL with real values | ❌ opt-in | literals: emails, tokens, ids |
| Bindings | ❌ opt-in | the actual parameter values |
If your provider needs the real values for better advice, opt in explicitly — and put a redactor in front for defense in depth:
SLOWER_AI_SEND_RAW_SQL=true
SLOWER_AI_SEND_BINDINGS=true
// config/slower.php
'ai_payload' => [
    'send_raw_sql' => env('SLOWER_AI_SEND_RAW_SQL', false),
    'send_bindings' => env('SLOWER_AI_SEND_BINDINGS', false),
    'redactor' => App\Support\SlowerRedactor::class,
],
namespace App\Support;

use HalilCosdu\Slower\Contracts\PayloadRedactor;

class SlowerRedactor implements PayloadRedactor
{
    public function redactBindings(array $bindings): array
    {
        return array_map(
            fn ($value) => is_string($value) && str_contains($value, '@') ? '[email]' : $value,
            $bindings,
        );
    }

    public function redactRawSql(string $rawSql): string
    {
        return preg_replace('/\b[\w.+-]+@[\w-]+\.[\w.]+\b/', '[email]', $rawSql);
    }
}
A misconfigured redactor (a class that doesn't implement the contract) throws instead of silently passing secrets. The redactor covers every outbound path — raw SQL, bindings, and the EXPLAIN plan (which can echo literal values on some drivers) — so a configured redactor is applied consistently. Without a redactor, set SLOWER_AI_RECOMMENDATION_USE_EXPLAIN=false in strict environments to keep plan literals out of the payload.
Queued analysis
An LLM round-trip takes seconds; by default Slower analyzes synchronously (no worker needed). On any app with a queue, flip one variable and analysis becomes background work:
SLOWER_ANALYZE_QUEUE=default # any queue name; unset = synchronous
- The dashboard's Analyze buttons dispatch jobs and return immediately.
php artisan slower:analyze --queuequeues every pending record instead of processing them inline.- Jobs are unique per record — double-clicks and overlapping scheduler runs can't queue duplicate (billable) analyses.
- Failures follow your queue's retry semantics, and a record is only marked analyzed when a recommendation was actually stored.
# A worker for that queue, and you're done:
php artisan queue:work --queue=default
Events
Slower ships events, not notification channels — wire them to whatever your team uses:
HalilCosdu\Slower\Events\SlowQueryCaptured— fired for every stored capture.HalilCosdu\Slower\Events\SlowQueryFirstSeen— fired only the first time a query shape is ever captured. This is the "a new slow query appeared" signal, without the noise of repeats.
A complete Slack alert in ~15 lines — listen for first-seen shapes and notify:
// app/Providers/AppServiceProvider.php
use HalilCosdu\Slower\Events\SlowQueryFirstSeen;
use Illuminate\Support\Facades\Event;
use Illuminate\Support\Facades\Notification;

public function boot(): void
{
    Event::listen(function (SlowQueryFirstSeen $event) {
        Notification::route('slack', config('services.slack.alerts_webhook'))
            ->notify(new \App\Notifications\NewSlowQuery($event->record));
    });
}
// app/Notifications/NewSlowQuery.php (the interesting part)
public function toSlack(object $notifiable): SlackMessage
{
    $origin = $this->record->origin['action'] ?? $this->record->origin['job'] ?? 'unknown origin';

    return (new SlackMessage)
        ->text(sprintf(
            '🐌 New slow query (%.0f ms) from %s: %s',
            $this->record->time,
            $origin,
            \Illuminate\Support\Str::limit($this->record->sql, 120),
        ));
}
Configuration
This is the full contents of the published config file:
use HalilCosdu\Slower\Http\Middleware\Authorize;
use HalilCosdu\Slower\Models\SlowLog;

return [
    'enabled' => env('SLOWER_ENABLED', true),
    'threshold' => env('SLOWER_THRESHOLD', 10000), // ms
    'ai_service' => env('SLOWER_AI_SERVICE', 'openai'),
    'capture' => [
        'sample_rate' => env('SLOWER_SAMPLE_RATE', 1.0),
        'max_per_execution' => env('SLOWER_MAX_PER_EXECUTION', 50),
        'origin' => [
            'enabled' => env('SLOWER_CAPTURE_ORIGIN', true),
            'user_id' => env('SLOWER_CAPTURE_USER_ID', false),
        ],
    ],
    'resources' => [
        'table_name' => (new SlowLog)->getTable(),
        'model' => SlowLog::class,
    ],
    'dashboard' => [
        'enabled' => env('SLOWER_DASHBOARD_ENABLED', true),
        'path' => env('SLOWER_DASHBOARD_PATH', 'slower'),
        'domain' => env('SLOWER_DASHBOARD_DOMAIN'),
        'middleware' => [
            'web',
            Authorize::class,
        ],
        'per_page' => 25,
        'analyze_pending_limit' => 10,
    ],
    'ai_recommendation' => env('SLOWER_AI_RECOMMENDATION', true),
    // null = analyze synchronously; a queue name = analyze as background jobs
    'analyze_queue' => env('SLOWER_ANALYZE_QUEUE'),
    'ai_payload' => [
        'send_raw_sql' => env('SLOWER_AI_SEND_RAW_SQL', false),
        'send_bindings' => env('SLOWER_AI_SEND_BINDINGS', false),
        'redactor' => null, // class-string implementing Contracts\PayloadRedactor
    ],
    // null → a sensible low-cost default for the selected provider
    'recommendation_model' => env('SLOWER_AI_RECOMMENDATION_MODEL'),
    'recommendation_use_explain' => env('SLOWER_AI_RECOMMENDATION_USE_EXPLAIN', true),
    'ignore_explain_queries' => env('SLOWER_IGNORE_EXPLAIN_QUERIES', true),
    'ignore_insert_queries' => env('SLOWER_IGNORE_INSERT_QUERIES', true),
    'prompt' => env('SLOWER_PROMPT', '...'), // the system prompt sent to the AI
];
A few keys worth tuning:
threshold— the millisecond bar for "slow". Lower it in staging to surface more, raise it in production to keep the table lean.capture.sample_rate/capture.max_per_execution— the production controls for high-traffic apps.ai_recommendation— set tofalseto keep logging slow queries while never calling an AI API (no charges).analyze_queue— a queue name to make analysis background work;nullkeeps it synchronous.ai_payload— the privacy contract for what reaches your provider.recommendation_use_explain— attaches a safe, read-onlyEXPLAINplan to the prompt for sharper advice.
AI providers
Slower talks to every major LLM through one official package — Prism. There are no provider credentials in Slower's own config: you pick a provider with a single variable, and Prism reads the key from its own config (config/prism.php), which in turn reads the conventional environment variables.
SLOWER_AI_SERVICE=openai # openai · anthropic · gemini · ollama · … · or a custom driver
ai_service |
Default model |
|---|---|
openai (default) |
gpt-5.4-mini |
anthropic |
claude-haiku-4-5 |
gemini |
gemini-2.5-flash |
| any other Prism provider | you must set the model |
Override any default with SLOWER_AI_RECOMMENDATION_MODEL.
Note
Upgrading from an OpenAI-only version? Nothing to change — Prism reads your existing OPENAI_API_KEY, and a boot-time bridge still honors a legacy slower.open_ai.api_key.
Below is the exact setup for each major provider. In every case only two lines are required — SLOWER_AI_SERVICE and the provider's API key; everything else is an optional override, shown commented out with its default value.
OpenAI
SLOWER_AI_SERVICE=openai
OPENAI_API_KEY=sk-...

# Optional overrides (defaults shown)
# SLOWER_AI_RECOMMENDATION_MODEL=gpt-5.4-mini
# OPENAI_URL=https://api.openai.com/v1     # point at Azure OpenAI or a proxy
# OPENAI_ORGANIZATION=
# OPENAI_PROJECT=
Get a key at platform.openai.com.
Anthropic (Claude)
SLOWER_AI_SERVICE=anthropic
ANTHROPIC_API_KEY=sk-ant-...

# Optional overrides (defaults shown)
# SLOWER_AI_RECOMMENDATION_MODEL=claude-haiku-4-5
# ANTHROPIC_API_VERSION=2023-06-01
# ANTHROPIC_URL=https://api.anthropic.com/v1
Get a key at console.anthropic.com.
Google Gemini
SLOWER_AI_SERVICE=gemini
GEMINI_API_KEY=...

# Optional overrides (defaults shown)
# SLOWER_AI_RECOMMENDATION_MODEL=gemini-2.5-flash
# GEMINI_URL=https://generativelanguage.googleapis.com/v1beta/models
Get a key at aistudio.google.com.
Self-hosted & OpenAI-compatible (Ollama, LM Studio, OpenRouter, Groq, …)
Any Prism provider works. These have no built-in default model, so you must name one:
SLOWER_AI_SERVICE=ollama
SLOWER_AI_RECOMMENDATION_MODEL=qwen2.5-coder

# Optional overrides (default shown)
# OLLAMA_URL=http://localhost:11434
A fully custom driver
For a bespoke backend, register a driver in a service provider — no HTTP code required from Slower:
use HalilCosdu\Slower\AiServiceDrivers\AiServiceManager;
use HalilCosdu\Slower\AiServiceDrivers\Contracts\AiServiceDriver;

app(AiServiceManager::class)->extend('my-llm', fn () => new class implements AiServiceDriver
{
    public function analyze(string $userMessage): ?string
    {
        // Call your model. Return the recommendation text, or null to retry later.
    }
});
Then set SLOWER_AI_SERVICE=my-llm.
Tip
Model ids move fast. If a default drifts, pin the current low-cost model for your provider with SLOWER_AI_RECOMMENDATION_MODEL. AI requests time out after Prism's default of 30 seconds — raise it with PRISM_REQUEST_TIMEOUT (seconds) for very large schemas or slower models.
Commands and scheduling
php artisan slower:analyze           # analyze every record where is_analyzed=false
php artisan slower:analyze --queue   # ...as unique background jobs instead
php artisan slower:clean 15          # delete records older than 15 days
php artisan slower:fingerprint       # one-time: fingerprint records captured before v3.2
Run them on a schedule so analysis and retention take care of themselves:
use HalilCosdu\Slower\Commands\AnalyzeQuery;
use HalilCosdu\Slower\Commands\SlowLogCleaner;

protected function schedule(Schedule $schedule): void
{
    $schedule->command(AnalyzeQuery::class)->runInBackground()->daily();
    $schedule->command(SlowLogCleaner::class)->runInBackground()->daily();
}
Programmatic usage
Everything the dashboard does is available through the Slower facade and the SlowLog model.
use HalilCosdu\Slower\Facades\Slower;
use HalilCosdu\Slower\Models\SlowLog;

// Analyze a single captured query — returns the analyzed model.
$record = SlowLog::first();

Slower::analyze($record);

$record->raw_sql;        // select count(*) as aggregate from "product_prices" where ...
$record->recommendation; // the AI's optimization advice (markdown)
Because slow queries are plain Eloquent records, you can query and act on them however you like:
use HalilCosdu\Slower\Facades\Slower;
use HalilCosdu\Slower\Models\SlowLog;

// How many queries are still waiting for analysis?
$pending = SlowLog::where('is_analyzed', false)->count();

// Analyze the twenty slowest unanalyzed queries.
SlowLog::query()
    ->where('is_analyzed', false)
    ->orderByDesc('time')
    ->limit(20)
    ->get()
    ->each(fn (SlowLog $log) => Slower::analyze($log));

// The most frequent slow query shapes (what the Grouped view shows).
SlowLog::query()
    ->whereNotNull('fingerprint')
    ->selectRaw('fingerprint, count(*) as occurrences, max(time) as max_time')
    ->groupBy('fingerprint')
    ->orderByDesc('occurrences')
    ->limit(5)
    ->get();

// Where did this one come from?
$record->fingerprint;        // 40-char shape hash, shared by all repeats
$record->origin;             // ['type' => 'http', 'route' => 'orders.index',
                             //  'action' => 'App\...\OrderController@index',
                             //  'frame' => 'app/Http/Controllers/OrderController.php:38']
Example recommendation
- Indexing: consider adding a composite index on
product_id,price, anddiscount_total:
CREATE INDEX idx_product_prices
ON product_prices (product_id, price, discount_total);
- Data types: remove the quotes around numeric comparisons so the index can actually be used:
SELECT COUNT(*) AS aggregate
FROM product_prices
WHERE product_id = 1 AND price = 0 AND discount_total > 0;
- Statistics: run
ANALYZE product_prices;so the query planner has fresh statistics to work with.
Development and testing
composer test       # Pest test suite
composer analyse    # PHPStan level 5
composer format     # Laravel Pint
composer start      # build the workbench demo app (seeded) and serve the dashboard
Changelog
Please see CHANGELOG for more information on what has changed recently.
Contributing
Please see CONTRIBUTING for details.
Security Vulnerabilities
Please review our security policy on how to report security vulnerabilities.
Credits
License
The MIT License (MIT). Please see License File for more information.