paulo-hortelan / requests-graph-pulse
This is my package requests-graph-pulse
Package info
github.com/paulo-hortelan/requests-graph-pulse
pkg:composer/paulo-hortelan/requests-graph-pulse
Requires
- php: ^8.1
- laravel/framework: ^10.0|^11.0|^12.0
- laravel/pulse: ^1.0@beta
- spatie/laravel-package-tools: ^1.14.0
Requires (Dev)
- larastan/larastan: ^2.7|^3.1.0
- laravel/pint: ^1.0
- nunomaduro/collision: ^7.8|^8.0
- orchestra/testbench: ^8.25|^9.2|^10.0
- pestphp/pest: ^2.20|^3.7
- pestphp/pest-plugin-arch: ^2.6|^3.0
- pestphp/pest-plugin-laravel: ^2.0|^3.0
- phpstan/extension-installer: ^1.1
- phpstan/phpstan-deprecation-rules: ^1.0|^2.0.1
- phpstan/phpstan-phpunit: ^1.0|^2.0.4
- spatie/laravel-ray: ^1.26
- dev-main
- v1.2.2
- v1.2.1
- v1.2
- v1.1
- v1.0.6
- v1.0.5
- v1.0.4
- v1.0.3
- v1.0.2
- v1.0.1
- v1.0
- dev-dependabot/github_actions/dependabot/fetch-metadata-3.1.0
- dev-dependabot/github_actions/dependabot/fetch-metadata-3.0.0
- dev-dependabot/github_actions/ramsey/composer-install-4
- dev-dependabot/github_actions/actions/checkout-6
This package is auto-updated.
Last update: 2026-04-20 22:01:05 UTC
README
Requests Graph for Laravel Pulse
Credits to Aaron Francis for his Pulse tutorial.
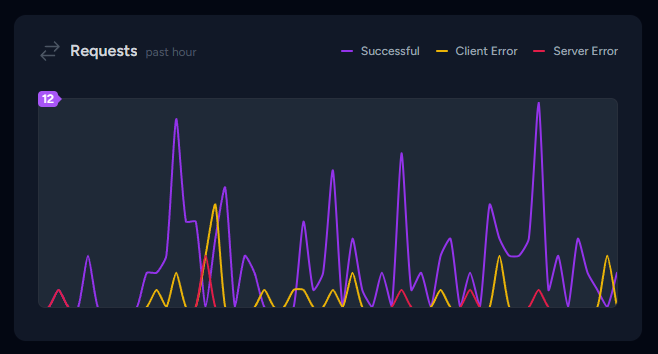
This is a Laravel Pulse package that adds a graph showing the latest requests.
- Customizable requests status to be shown
Installation
You can install the package via composer:
composer require paulo-hortelan/requests-graph-pulse
Register the recorder
Add the RequestsGraphRecorder inside config/pulse.php. (If you don't have this file make sure you have published the config file of Larave Pulse using php artisan vendor:publish --tag=pulse-config)
return [
    // ...

    'recorders' => [
        // Existing recorders...

        \PauloHortelan\RequestsGraphPulse\Recorders\RequestsGraphRecorder::class => [
            'enabled' => env('PULSE_REQUESTS_GRAPH_ENABLED', true),
            'sample_rate' => env('PULSE_REQUESTS_GRAPH_SAMPLE_RATE', 1),
            'record_informational' => env('PULSE_REQUESTS_GRAPH_RECORD_INFORMATIONAL', false),
            'record_successful' => env('PULSE_REQUESTS_GRAPH_RECORD_SUCCESSFUL', true),
            'record_redirection' => env('PULSE_REQUESTS_GRAPH_RECORD_REDIRECTION', false),
            'record_client_error' => env('PULSE_REQUESTS_GRAPH_RECORD_CLIENT_ERROR', true),
            'record_server_error' => env('PULSE_REQUESTS_GRAPH_RECORD_SERVER_ERROR', true),
            'ignore' => [
                '#^/pulse$#', // Pulse dashboard...
            ],
        ],
    ]
]
Add to your dashboard
To add the card to the Pulse dashboard, you must first publish the vendor view.
php artisan vendor:publish --tag=pulse-dashboard
Then, you can modify the dashboard.blade.php file and add the requests-graph livewire template:
<livewire:requests-graph cols="6" />
Testing
composer test
TODO
- Give the option to record the endpoint for each request
- Filter the graph requests for selected endpoint
Changelog
Please see CHANGELOG for more information on what has changed recently.
Contributing
Please see CONTRIBUTING for details.
Security Vulnerabilities
Please review our security policy on how to report security vulnerabilities.
Credits
License
The MIT License (MIT). Please see License File for more information.

