pragmarx / health
Laravel Server & App Health Monitor and Notifier
Requires
- php: >=7.3
- ext-json: *
- illuminate/support: >=8.0
- phpunit/php-timer: ^1.0|^2.0|^3.0|^4.0|^5.0
- pragmarx/yaml: >=0.1
Requires (Dev)
- docusign/esign-client: >=2.0
- guzzlehttp/guzzle: >=6.0
- laravel/framework: 9.*
- laravel/laravel: >=8.0
- nesbot/carbon: >=1.34
- orchestra/testbench: 5.*|6.*|7.*
- phpunit/phpunit: >=6.5
- predis/predis: >=1.0
Suggests
- docusign/esign-client: >=2.0
- guzzlehttp/guzzle: >=6.0
- league/flysystem-aws-s3-v3: >=1.0
- predis/predis: >=1.0
- sensiolabs/security-checker: >=4.1
- spatie/ssl-certificate: >=1.0
- dev-master
- v2.0.5
- v2.0.4
- v2.0.3
- v2.0.2
- v2.0.1
- v2.0.0
- v1.1.6
- v1.1.5
- v1.1.3
- v1.1.2
- v1.1.1
- v1.1.0
- v1.0.2
- v1.0.1
- v1.0.0
- v0.11.1
- v0.11.0
- v0.10.4
- v0.10.3
- V0.10.2
- v0.10.1
- v0.10.0
- v0.9.18
- v0.9.17
- v0.9.16
- v0.9.15
- v0.9.14
- v0.9.13
- v0.9.12
- v0.9.11
- v0.9.10
- v0.9.9
- v0.9.8
- v0.9.7
- v0.9.6
- v0.9.5
- v0.9.0
- v0.4.0
- v0.3.3
- v0.3.2
- v0.3.1
- v0.3.0
- v0.2.6
- v0.2.5
- v0.2.4
- v0.2.3
- v0.2.2
- v0.2.1
- v0.2.0
- v0.1.9
- v0.1.8
- v0.1.7
- v0.1.6
- v0.1.5
- v0.1.4
- v0.1.3
- v0.1.2
- v0.1.1
- v0.1.0
- dev-dependabot/composer/phpunit/php-timer-tw-7.0.1
- dev-dependabot/composer/laravel/framework-11.star
- dev-fix/empty-elapsed-time
- dev-dependabot/add-v2-config-file
- dev-feature/add-total-time-to-console-panel
- dev-feature/ssl-certificates
- dev-feature/debug-mode-production-only
- dev-pr-220
- dev-feature/improve-routes-speed
- dev-feature/add-checkout-com-checker
- dev-feature/refactor-security-check
- dev-analysis-lZE6Jk
- dev-fix/security-issues
- dev-fix/timer
- dev-fix/remove-composer-lock
- dev-materialdesign
This package is auto-updated.
Last update: 2026-04-15 16:26:31 UTC
README
Laravel Server & App Health Monitor and Notifier
This package checks if the application resources are running as they should and creates a service status panel. It has the following main points:
- Highly extensible and configurable: you can create new checkers and notifiers very easily, and you can virtually change everything on it.
- Easy configuration: uses YAML as configuration files
- Resilient resource checker: if the framework is working and at least one notification channel, you should receive notification messages.
- Built-in notification system: get notifications via mail, slack, telegram or anything else you need.
- Routes for: panel, json result, string result and resource.
- Configurable panel design.
- Cache.
- Schedule checks to automatically receive notifications when a service fails.
- View app error messages right in the panel.
- Http response codes 200 and 500, on error, for services like Envoyer to keep track of your app health.
Built-in Resources
Heath has pre-configured resource checkers for the following services:
- Adyen
- AppKey
- APIs
- Broadcasting
- Cache
- ConfigurationCached
- Certificate
- Checkout.com
- Database
- DebugMode
- DirectoryPermissions
- DiskSpace
- DocuSign
- ElasticsearchConnectable
- EnvExists
- Filesystem
- Framework
- HealthPanel
- Horizon
- Http
- Https
- LaravelServices
- Latency
- LocalStorage
- MailgunConnectable
- MemcachedConnectable
- MigrationsUpToDate
- MixManifest
- MySql
- MySqlConnectable
- NewrelicDeamon
- NginxServer
- PackagesUpToDate
- Php
- PostgreSqlConnectable
- PostgreSqlServer
- Queue
- QueueWorkers
- RebootRequired
- Redis
- RedisConnectable
- RedisServer
- RoutesCached
- S3
- SecurityChecker
- SeeTickets
- Sendinblue
- ServerLoad
- ServerVars
- ServerUptime
- Sshd
- Supervisor
But you can add anything else you need, you just have to find the right checker to use or just create a new checker for your resource.
Panel of Panels
If you have a lot of websites to check, you can use the HealthPanel checker to create a Health Monitor application to check all your remote monitors and create a dashboard to summarize the state of all your websites.
Easy Configuration
Creating new resources monitors is easy, just create a new YAML file in app's config/health folder and it's done. Here's some examples:
Amazon S3
name: S3
abbreviation: s3
checker: PragmaRX\Health\Checkers\CloudStorageChecker
notify: true
driver: s3
file: pragmarx-health-s3-testfile.txt
contents: {{ str_random(32) }}
error_message: 'Amazon S3 connection is failing.'
column_size: 4
Nginx
name: NginxServer
abbreviation: ngnxsrvr
checker: PragmaRX\Health\Checkers\ProcessChecker
command: 'pgrep %s'
method: process_count
process_name: nginx
instances:
    minimum:
        count: 4
        message: 'Process "%s" has not enough instances running: it has %s, when should have at least %s'
    maximum:
        count: 8
        message: 'Process "%s" exceeded the maximum number of running instances: it has %s, when should have at most %s'
notify: true
pid_file_missing_error_message: 'Process ID file is missing: %s.'
pid_file_missing_not_locked: 'Process ID file is not being used by any process: %s.'
column_size: 4
Screenshots
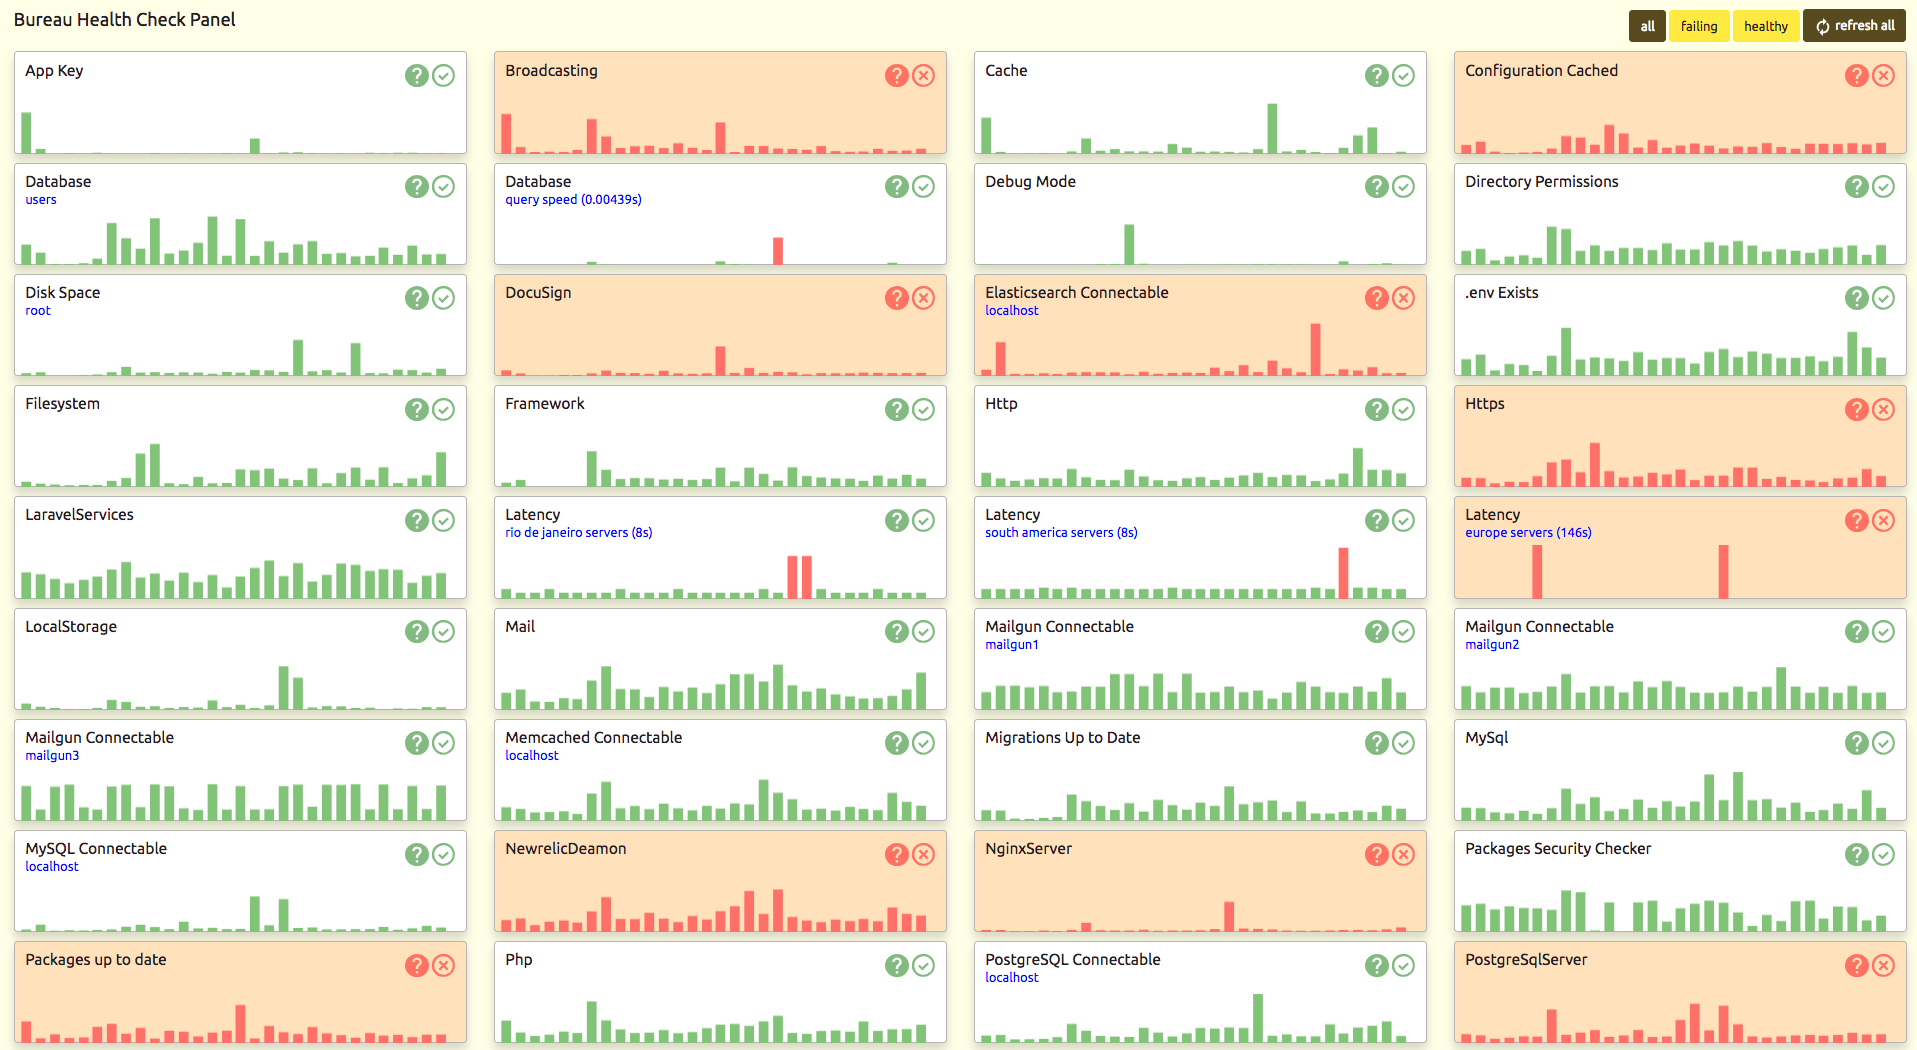
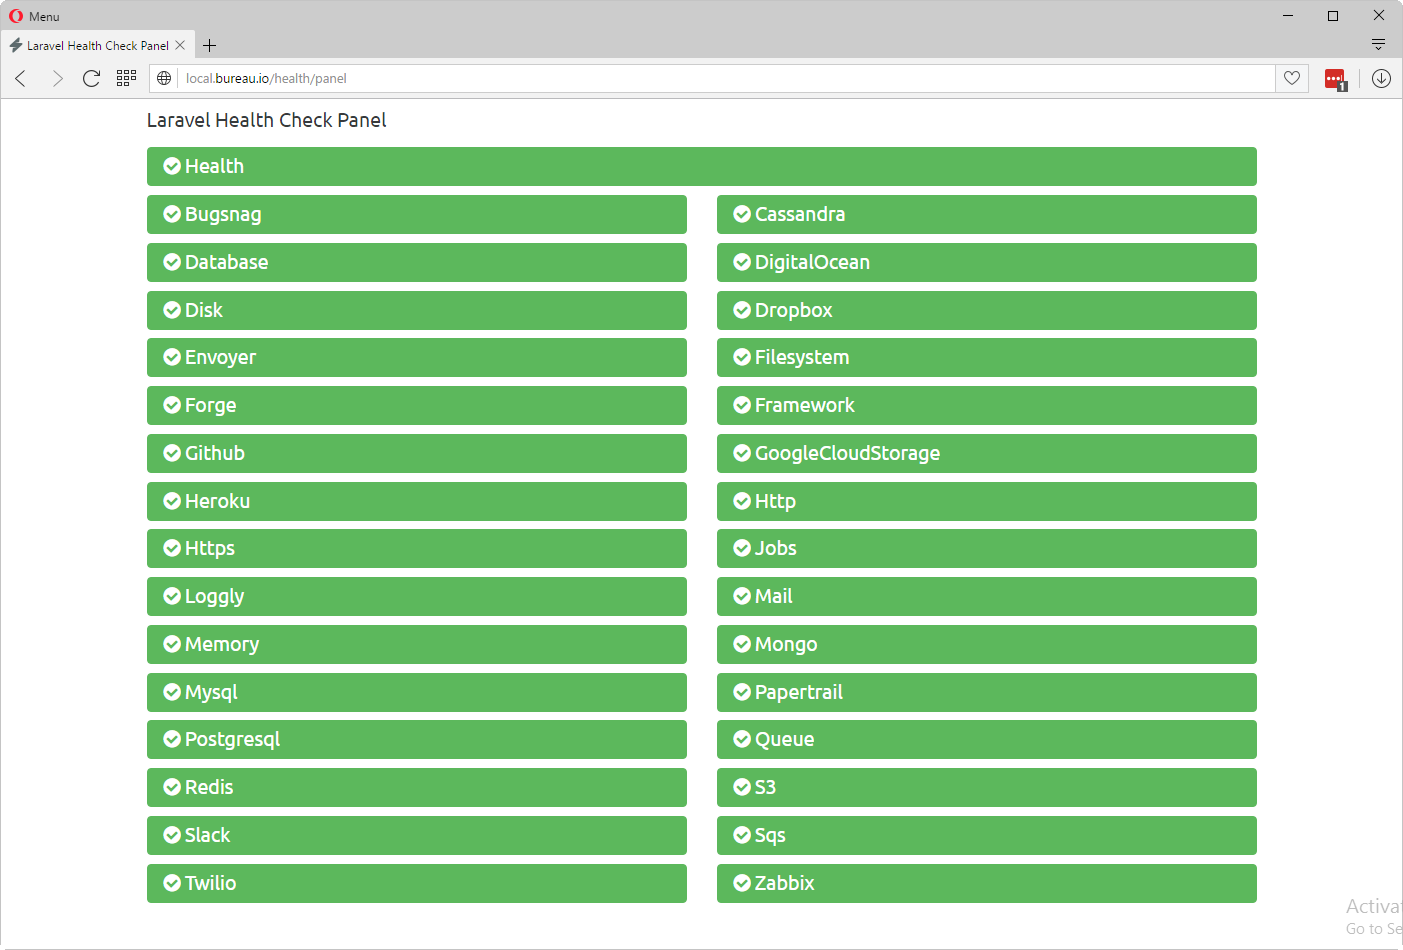
Panel
Panel alternate design
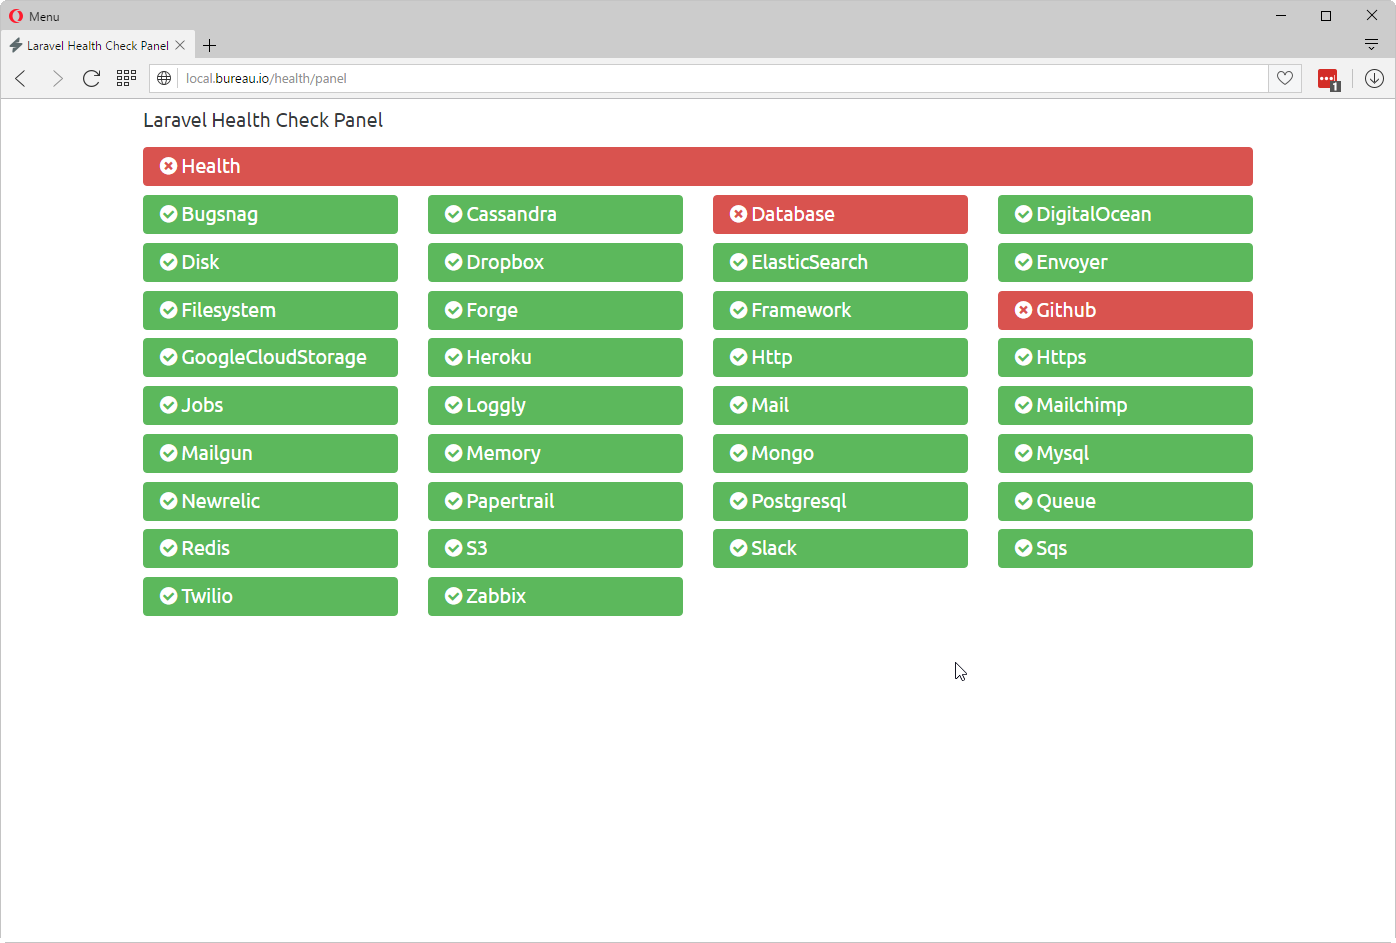
If you have lots of services to check, you may change the default panel design to use less space:
Panel in 4 columns layout
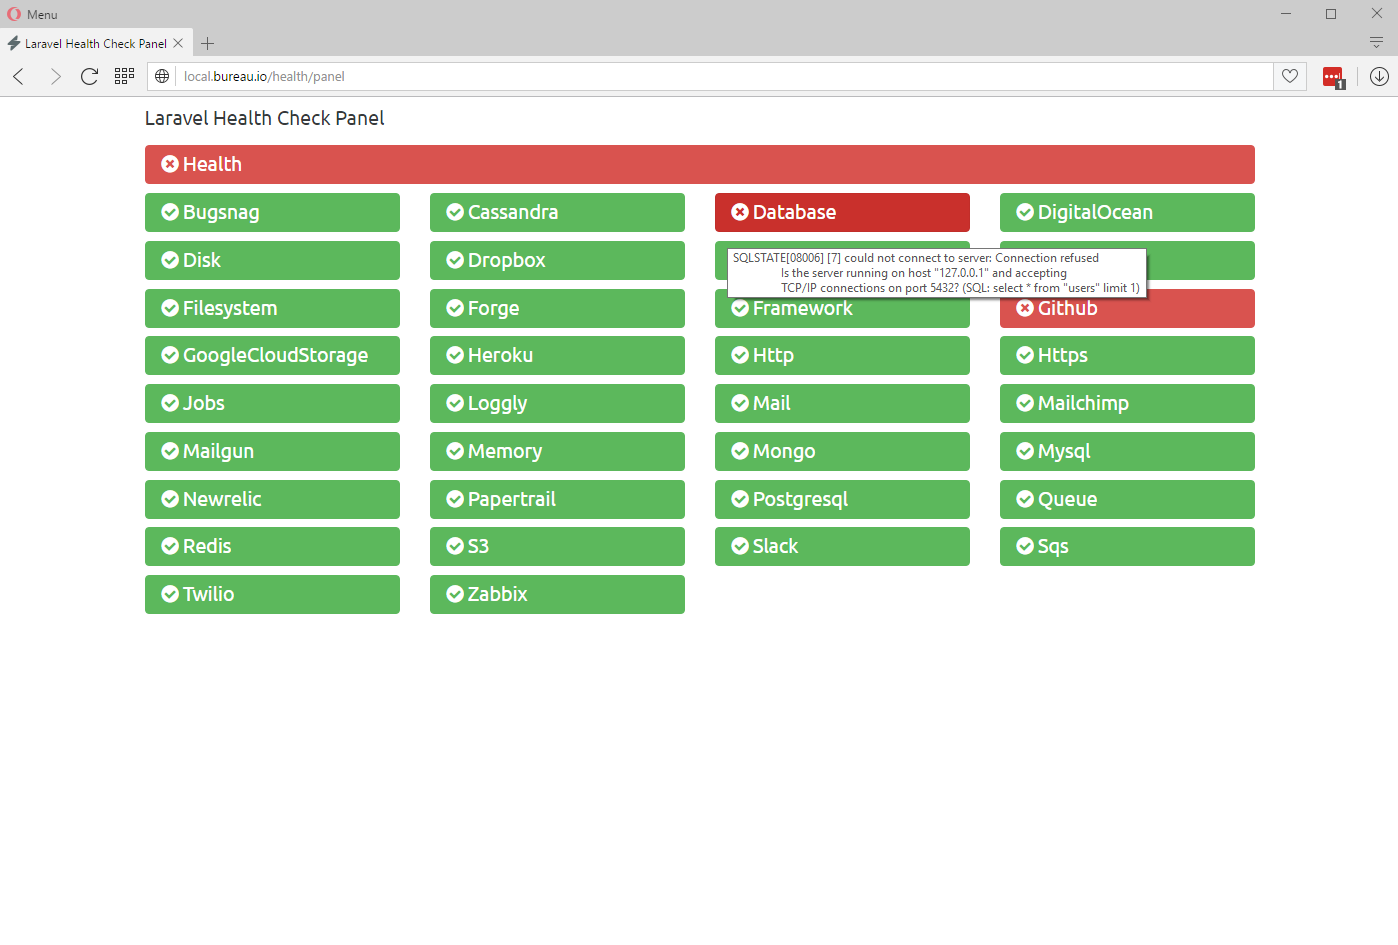
Error Messages
Mouse over a failing resource and get instant access to the error message:
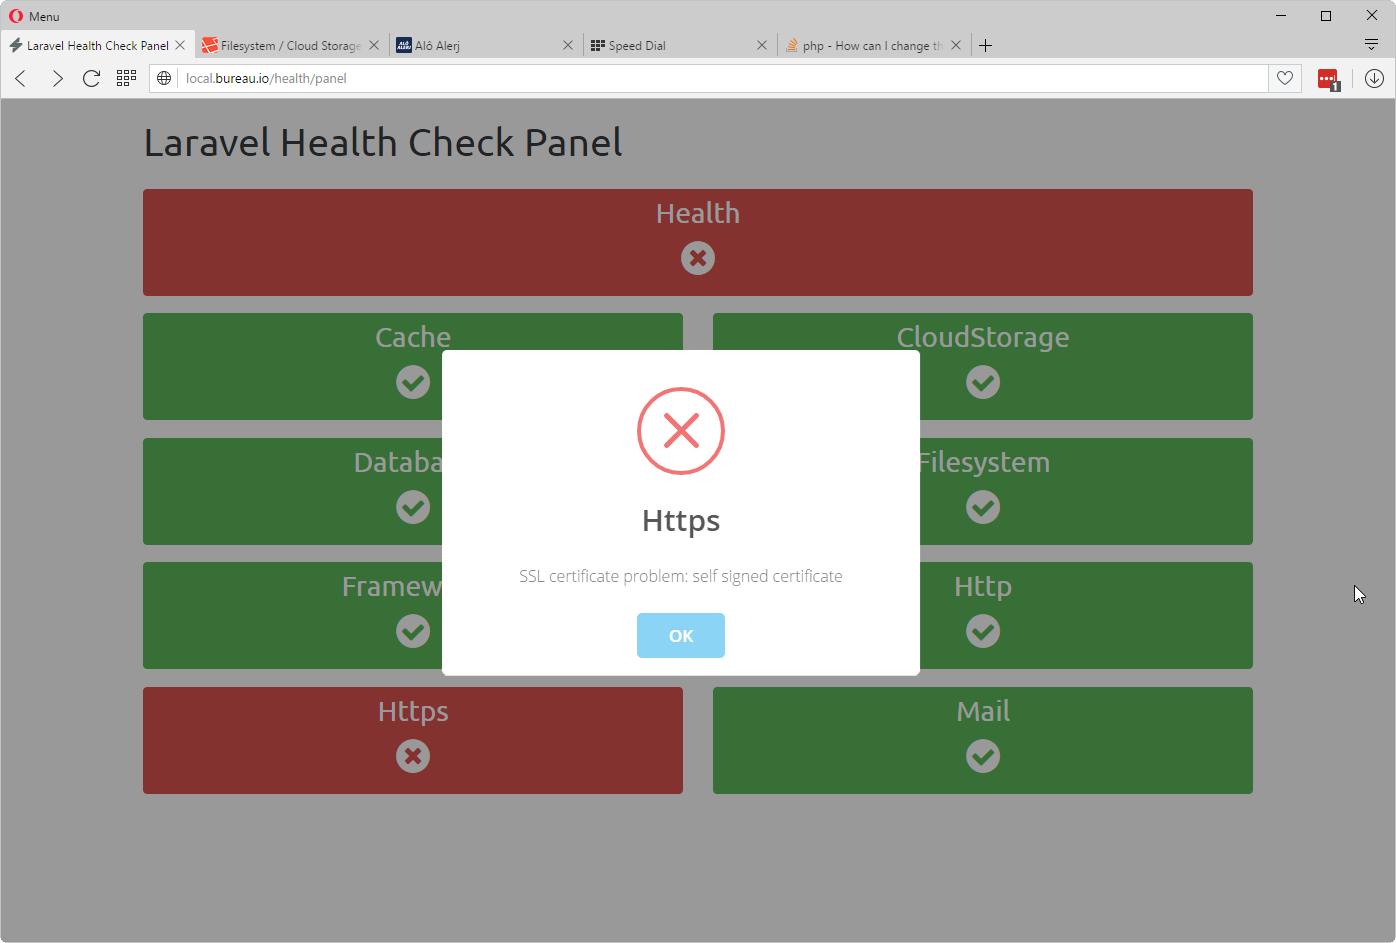
Click the resource button and you'll get an alert showing the error message:
Slack Notification
Here's an example of notification sent via Slack:
Artisan Console Commands
The health check commands below also return an exit code in a standard format:
| Numeric Value | Service Status | Status Description |
|---|---|---|
| 0 | OK | Service and appears to be functioning properly |
| 1 | Warning | Check ran okay, but was above some "warning" threshold |
| 2 | Critical | The check detected service is not running or is above a "critical" threshold |
| 3 | Unknown | Settings for the service check may be misconfigured and is preventing the check for being performed |
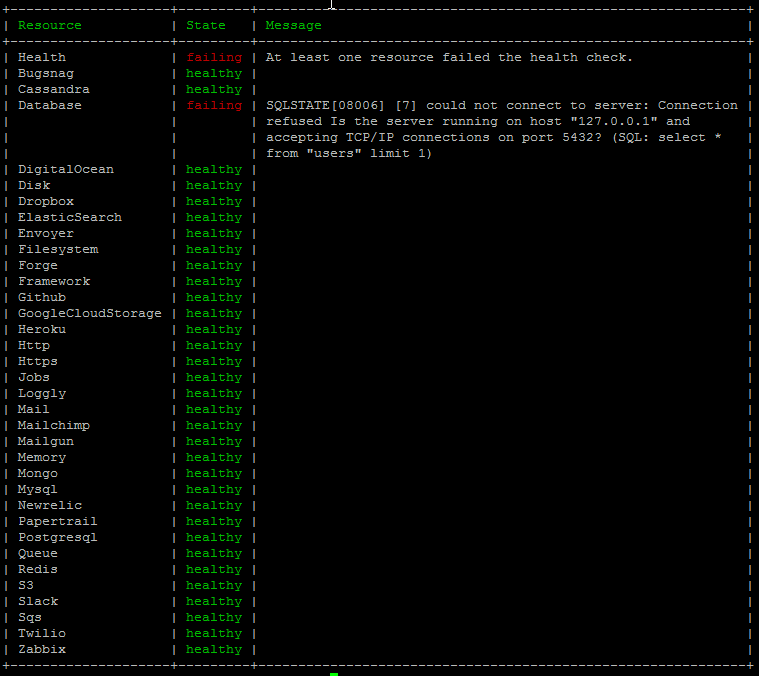
health:panel
Use the command health:panel to view the status of your services in console.
health:check
Use the command health:check to check all your resources and send notifications on failures.
Routes
After installing you will have access to the following routes:
/health/panel
The main panel route.
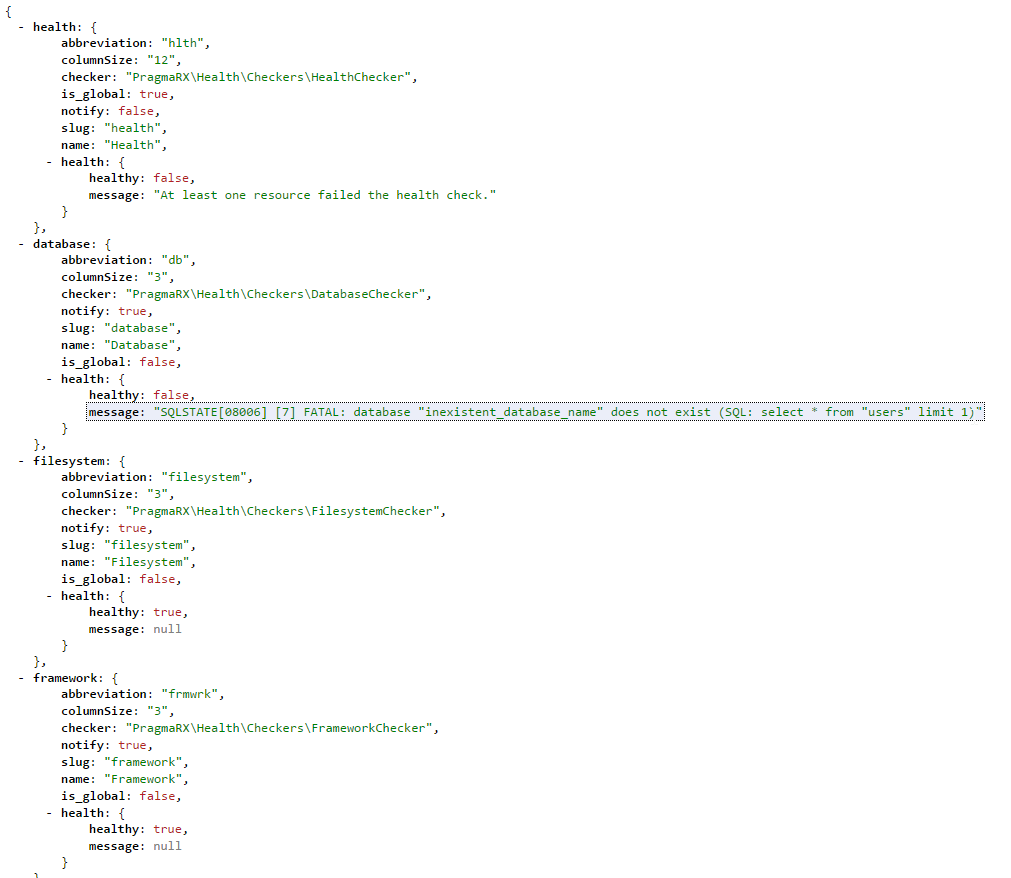
/health/check
Returns a json with everything the package knows about your services:
/health/string
Returns a string with status on all your services, useful when using other monitoring services:
hlthFAIL-dbFAIL-filesystemOK-frmwrkOK-httpOK-httpsOK-mailOK
/health/resource/{name}
Returns a json with information about a particular service:
Requirements
- PHP 7.3+
- Laravel 8.0+
Installing
Use Composer to install it:
composer require pragmarx/health
Installing on Laravel
Add the Service Provider to your config/app.php:
PragmaRX\Health\ServiceProvider::class,
Publish config and views
php artisan vendor:publish --provider="PragmaRX\Health\ServiceProvider"
Hit The Health Panel
http://yourdomain.com/health/panel
Configure All The Things
Almost everything is easily configurable in this package:
- Panel name
- Title and messages
- Resource checkers
- Slack icon
- Notification channels
- Template location
- Routes and prefixes
- Mail server
- Cache
- Scheduler
Configure binaries
Some of the checkers need you to configure the proper binary path for the checker to work:
'services' => [
    'ping' => [
        'bin' => env('HEALTH_PING_BIN', '/sbin/ping'),
    ],

    'composer' => [
        'bin' => env('HEALTH_COMPOSER_BIN', 'composer'),
    ],
],
Allowing Slack Notifications
To receive notifications via Slack, you'll have to setup Incoming Webhooks and add this method to your User model with your webhook:
/**
 * Route notifications for the Slack channel.
 *
 * @return string
 */
public function routeNotificationForSlack()
{
    return config('services.slack.webhook_url');
}
Cache
When Health result is cached, you can flush the cache to make it process all resources again by adding ?flush=true to the url:
http://yourdomain.com/health/panel?flush=true
Events
If you prefer to build you own notifications systems, you can disable it and listen for the following event
PragmaRX\Health\Events\RaiseHealthIssue::class
Broadcasting Checker
Broadcasting checker is done via ping and pong system. The broadcast checker will ping your service, and it must pong back. Basically what you need to do is to call back a url with some data:
Redis + Socket.io
var request = require('request');
var server = require('http').Server();
var io = require('socket.io')(server);
var Redis = require('ioredis');
var redis = new Redis();

redis.subscribe('pragmarx-health-broadcasting-channel');

redis.on('message', function (channel, message) {
    message = JSON.parse(message);

    if (message.event == 'PragmaRX\\Health\\Events\\HealthPing') {
        request.get(message.data.callbackUrl + '?data=' + JSON.stringify(message.data));
    }
});

server.listen(3000);
Pusher
<!DOCTYPE html>
<html>
    <head>
        <title>Pusher Test</title>
        <script src="https://js.pusher.com/3.2/pusher.min.js"></script>
        <script>
            var pusher = new Pusher('YOUR-PUSHER-KEY', {
                encrypted: true
            });

            var channel = pusher.subscribe('pragmarx-health-broadcasting-channel');

            channel.bind('PragmaRX\\Health\\Events\\HealthPing', function(data) {
                var request = (new XMLHttpRequest());

                request.open("GET", data.callbackUrl + '?data=' + JSON.stringify(data));

                request.send();
            });
        </script>
    </head>

    <body>
        Pusher waiting for events...
    </body>
</html>
Programatically checking resources
$generalHealthState = app('pragmarx.health')->checkResources();

// or

$databaseHealthy = app('pragmarx.health')->checkResource('database')->isHealthy();
Checking in artisan commands example:
Artisan::command('database:health', function () {
    app('pragmarx.health')->checkResource('database')->isHealthy()
        ? $this->info('database is healthy')
        : $this->info('database is in trouble')
    ;
})->describe('Check database health');
SecurityChecker
As the SensioLabs Security Checker package was abandoned, this checker now depends on local-php-security-checker. You need to compile or install it on your server or container in order to use this checker, and update the config/resources/SecurityChecker.yml file accordingly.
Lumen
To use it on Lumen, you'll probably need to do something like this on your bootstrap/app.php:
$app->instance('path.config', app()->basePath() . DIRECTORY_SEPARATOR . 'config');
$app->instance('path.storage', app()->basePath() . DIRECTORY_SEPARATOR . 'storage');

$app->withFacades();

$app->singleton('Illuminate\Contracts\Routing\ResponseFactory', function ($app) {
    return new \Illuminate\Routing\ResponseFactory(
        $app['Illuminate\Contracts\View\Factory'],
        $app['Illuminate\Routing\Redirector']
    );
});

$app->register(PragmaRX\Health\ServiceProvider::class);
Testing
$ composer test
Author
License
Health is licensed under the BSD 3-Clause License - see the LICENSE file for details
Contributing
Pull requests and issues are more than welcome.

