macocci7 / php-scatterplot
PHP-Scatterplot is a simple PHP library to create scatter plot easily.
Requires
- php: >=8.3
- intervention/image: ^4.0
- macocci7/php-combination: ^1.1
- macocci7/php-csv: ^1.1
- macocci7/php-frequency-table: ^1.4
- nette/neon: ^3.4
Requires (Dev)
- php-parallel-lint/php-parallel-lint: ^1.4
- phpstan/phpstan: ^2.1
- phpunit/phpunit: ^12.5
- squizlabs/php_codesniffer: ^4.0
README
1. Features
PHP-Scatterplot is a PHP library for creating scatter plots easily.
You can also retrieve parsed data:
Mean, Variance, Standard Deviation, Covariance,
Correlation Coefficient and Regression Line Formula.
Reference Line and Specification Limits are supported.
Multiple Layers (Data Sets) are supported.

Contents
3. Requirements
-
PHP 8.3 or later
-
Imagick PHP Extension
Check with commands:
(php -m; php -i) | grep imagick
-
Mbstring PHP Extension
Check with commands:
(php -m; php -i) | grep mbstring
4. Installation
composer require macocci7/php-scatterplot
5. Usage
- 5.1. Basic Usage
- 5.2. Using Layers
- 5.3. Adjusting the Display By Methods
- 5.4. Adjusting the Display By Neon File
- 5.5. Adjusting the Display By Array
- 5.6. Transparent Background
- 5.7. Parsed Data
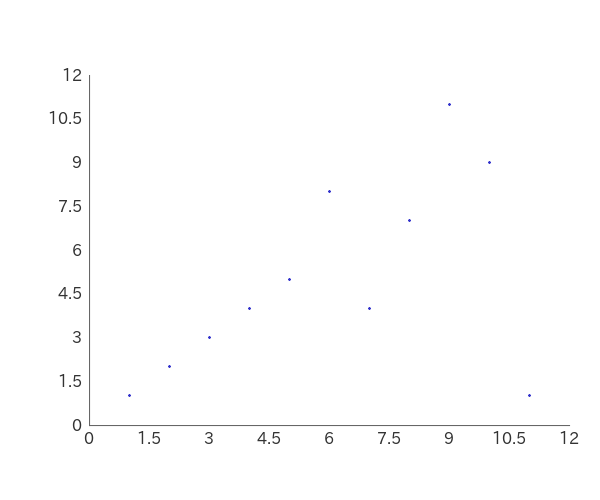
5.1. Basic Usage
-
<?php

require_once __DIR__ . '/../vendor/autoload.php';

use Macocci7\PhpScatterplot\Scatterplot;

$layers = [
    [
        'x' => [ 1, 2, 3, 4, 5, 6, 7, 8, 9, 10, 11, ],
        'y' => [ 1, 2, 3, 4, 5, 8, 4, 7, 11, 9, 1, ],
    ],
];

$sp = new Scatterplot();
$sp->layers($layers)
    ->create(__DIR__ . '/img/BasicUsage.png');
-
Result: examples/img/BasicUsage.png
-
Details:
- Import Autoloader:
require_once __DIR__ . '/../vendor/autoload.php' - Declare:
use Macocci7\PhpScatterplot - Prepare Data:
$layers = [ $layer ]$layers:array<int|string, array<string, list<int|float>>>$layer:array<string, list<int|float>>$layermust have hash keys ofxandy.- Hash arrays
xandymust have the same number of elements.
- Instantiate:
new Scatterplot() - Set Data:
layers($layers) - Create Image:
create($path)
- Import Autoloader:

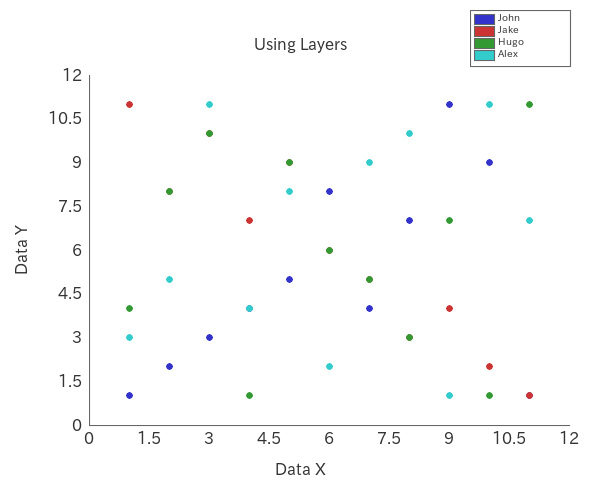
5.2. Using Layers
-
<?php

require_once __DIR__ . '/../vendor/autoload.php';

use Macocci7\PhpScatterplot\Scatterplot;

$layers = [
    'John' => [
        'x' => [ 1, 2, 3, 4, 5, 6, 7, 8, 9, 10, 11, ],
        'y' => [ 1, 2, 3, 4, 5, 8, 4, 7, 11, 9, 1, ],
    ],
    'Jake' => [
        'x' => [ 1, 2, 3, 4, 5, 6, 7, 8, 9, 10, 11, ],
        'y' => [ 11, 8, 10, 7, 9, 6, 5, 3, 4, 2, 1, ],
    ],
    'Hugo' => [
        'x' => [ 1, 2, 3, 4, 5, 6, 7, 8, 9, 10, 11, ],
        'y' => [ 4, 8, 10, 1, 9, 6, 5, 3, 7, 1, 11, ],
    ],
    'Alex' => [
        'x' => [ 1, 2, 3, 4, 5, 6, 7, 8, 9, 10, 11, ],
        'y' => [ 3, 5, 11, 4, 8, 2, 9, 10, 1, 11, 7, ],
    ],
];

$legends = array_keys($layers);

$sp = new Scatterplot();
$sp->layers($layers)
   ->plotSize(6)
   ->legends($legends)
   ->labelX('Data X')
   ->labelY('Data Y')
   ->caption('Using Layers')
   ->create(__DIR__ . '/img/UsingLayers.png');
-
Result: examples/img/UsingLayers.png
-
Details:
- Change Plot Size (Diameter):
plotSize(int $pixSize) - Set Legend Labels:
legends(string[] $legends) - Set Label for X Axis:
labelX(string $labelX) - Set Label for Y Axis:
labelY(string $labelY) - Set Caption:
caption(string $caption)
- Change Plot Size (Diameter):

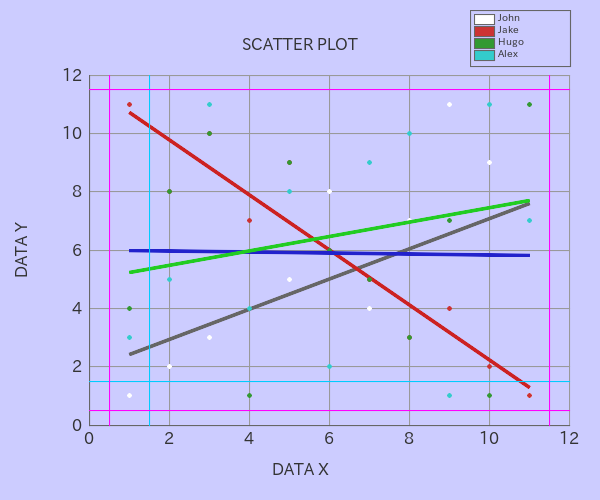
5.3. Adjusting the Display By Methods
-
PHP: examples/AdjustDisplayByMethods.php
<?php

require_once __DIR__ . '/../vendor/autoload.php';

use Macocci7\PhpScatterplot\Scatterplot;

$layers = [
    'John' => [
        'x' => [ 1, 2, 3, 4, 5, 6, 7, 8, 9, 10, 11, ],
        'y' => [ 1, 2, 3, 4, 5, 8, 4, 7, 11, 9, 1, ],
    ],
    'Jake' => [
        'x' => [ 1, 2, 3, 4, 5, 6, 7, 8, 9, 10, 11, ],
        'y' => [ 11, 8, 10, 7, 9, 6, 5, 3, 4, 2, 1, ],
    ],
    'Hugo' => [
        'x' => [ 1, 2, 3, 4, 5, 6, 7, 8, 9, 10, 11, ],
        'y' => [ 4, 8, 10, 1, 9, 6, 5, 3, 7, 1, 11, ],
    ],
    'Alex' => [
        'x' => [ 1, 2, 3, 4, 5, 6, 7, 8, 9, 10, 11, ],
        'y' => [ 3, 5, 11, 4, 8, 2, 9, 10, 1, 11, 7, ],
    ],
];

$legends = array_keys($layers);

$sp = new Scatterplot();
$sp->layers($layers)
   ->limitX(0, 12)
   ->limitY(0, 12)
   ->gridXPitch(2)
   ->gridYPitch(2)
   ->bgcolor('#ccccff')
   ->colors(['#ffffff'])
   ->plotSize(4)
   ->fontColor('#333333')
   ->grid(1, '#999999')
   ->gridXOn()
   ->gridYOn()
   ->regressionLine(3, [ '#666666', '#cc2222', '#2222cc', '#22cc22', ])
   ->referenceLineX(1.5, 1, '#00ccff')
   ->referenceLineY(1.5, 1, '#00ccff')
   ->specificationLimitX(0.5, 11.5, 1, '#ff00ff')
   ->specificationLimitY(0.5, 11.5, 1, '#ff00ff')
   ->labelX('DATA X')
   ->labelY('DATA Y')
   ->caption('SCATTER PLOT')
   ->legends($legends)
   ->create(__DIR__ . '/img/AdjustDisplayByMethods.png');
-
Result: examples/img/AdjustDisplayByMethods.png
-
Details:
Available Method limitX(int|float $lower, int|float $upper) limitY(int|float $lower, int|float $upper) resize(int $width, int $height) frame($xRatio, $yRatio) bgcolor(string|null $color = null) axis(int $width, string|null $color = null) grid(int $width, string|null $color = null) gridXPitch(int|float $pitch) gridYPitch(int|float $pitch) colors(array $colors) plotSize(int $size) fontPath(string $path) fontSize(int|float $size) fontColor(string $color) referenceLineX(int|float $x, int $width = 1, string $color = '#0000ff') referenceLineY(int|float $y, int $width = 1, string $color = '#0000ff') specificationLimitX(int|float $lower, int|float $upper, int $width = 1, string $color = '#ff00ff') specificationLimitY(int|float $lower, int|float $upper, int $width = 1, string $color = '#ff00ff') regressionLine(int $width, array $colors) labelX(string $label) labelY(string $label) caption(string $caption) legends(array $legends) gridXOn() gridXOff() gridYOn() gridYOff() referenceLineXOff() referenceLineYOff() referenceLinesOff() specificationLimitXOff() specificationLimitYOff() specificationLimitsOff() regressionLineOn() regressionLineOff() legendOff()
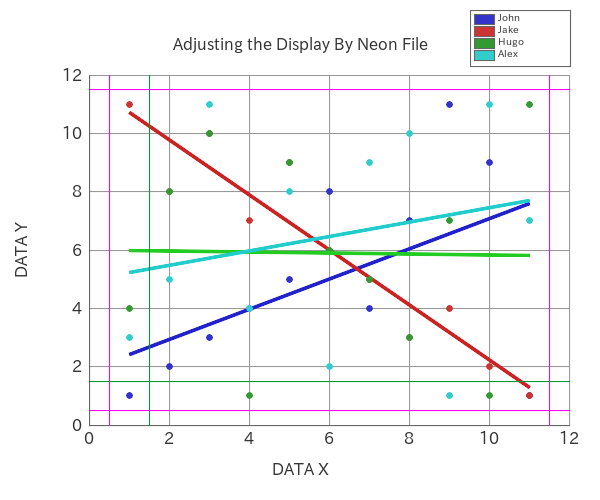
5.4. Adjusting the Display By Neon File
First, prepare a Neon file like this:
-
Neon: examples/AdjustDisplayByNeon.neon
#canvasWidth: 600
#canvasHeight: 500
canvasBackgroundColor: '#ccccff'
#frameXRatio: 0.8
#frameYRatio: 0.7
#axisColor: '#666666'
#axisWidth: 1
gridColor: '#999999'
#gridWidth: 1
gridXPitch: 2
gridYPitch: 2
gridX: true
gridY: true
xLimitUpper: 12
xLimitLower: 0
yLimitUpper: 12
yLimitLower: 0
plotDiameter: 6
#fontPath: '/usr/share/fonts/opentype/ipafont-gothic/ipagp.ttf'
#fontSize: 16
#fontColor: '#333333'
referenceLineX: true
referenceLineXValue: 1.5
referenceLineXWidth: 1
referenceLineXColor: '#009933'
referenceLineY: true
referenceLineYValue: 1.5
referenceLineYWidth: 1
referenceLineYColor: '#009933'
specificationLimitX: true
specificationLimitXLower: 0.5
specificationLimitXUpper: 11.5
specificationLimitXWidth: 1
specificationLimitXColor: '#ff00ff'
specificationLimitY: true
specificationLimitYLower: 0.5
specificationLimitYUpper: 11.5
specificationLimitYWidth: 1
specificationLimitYColor: '#ff00ff'
regressionLine: true
regressionLineWidth: 3
labelX: 'DATA X'
labelY: 'DATA Y'
caption: 'Adjusting the Display By Neon File'
legend: true
legends: [ 'John', 'Jake', 'Hugo', 'Alex', ]
legendWidth: 100
legendFontSize: 10
colors:
    - '#3333cc'
    - '#cc3333'
    - '#339933'
    - '#33cccc'
    - '#cc3333'
    - '#ffcc33'
    - '#cccc33'
    - '#cc33cc'
regressionLineColors:
    - '#2222cc'
    - '#cc2222'
    - '#22cc22'
    - '#22cccc'
Second, Code PHP like this:
-
PHP: examples/AdjustDisplayByNeon.php
<?php

require_once __DIR__ . '/../vendor/autoload.php';

use Macocci7\PhpScatterplot\Scatterplot;

$layers = [
    'John' => [
        'x' => [ 1, 2, 3, 4, 5, 6, 7, 8, 9, 10, 11, ],
        'y' => [ 1, 2, 3, 4, 5, 8, 4, 7, 11, 9, 1, ],
    ],
    'Jake' => [
        'x' => [ 1, 2, 3, 4, 5, 6, 7, 8, 9, 10, 11, ],
        'y' => [ 11, 8, 10, 7, 9, 6, 5, 3, 4, 2, 1, ],
    ],
    'Hugo' => [
        'x' => [ 1, 2, 3, 4, 5, 6, 7, 8, 9, 10, 11, ],
        'y' => [ 4, 8, 10, 1, 9, 6, 5, 3, 7, 1, 11, ],
    ],
    'Alex' => [
        'x' => [ 1, 2, 3, 4, 5, 6, 7, 8, 9, 10, 11, ],
        'y' => [ 3, 5, 11, 4, 8, 2, 9, 10, 1, 11, 7, ],
    ],
];

$sp = new Scatterplot();
$sp->layers($layers)
   ->config(__DIR__ . '/AdjustDisplayByNeon.neon')
   ->create(__DIR__ . '/img/AdjustDisplayByNeon.png');
Then, run the PHP code.

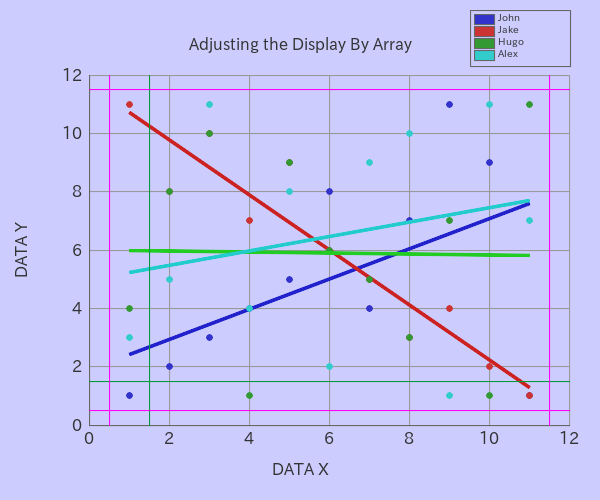
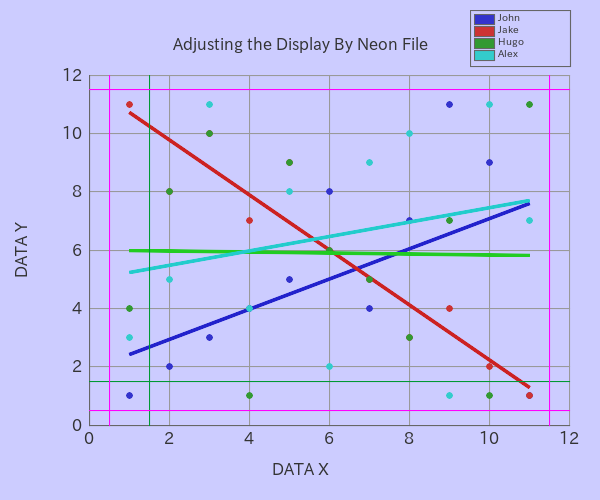
5.5. Adjusting the Display By Array
-
PHP: examples/AdjustDisplayByArray.php
<?php

require_once __DIR__ . '/../vendor/autoload.php';

use Macocci7\PhpScatterplot\Scatterplot;

$layers = [
    'John' => [
        'x' => [ 1, 2, 3, 4, 5, 6, 7, 8, 9, 10, 11, ],
        'y' => [ 1, 2, 3, 4, 5, 8, 4, 7, 11, 9, 1, ],
    ],
    'Jake' => [
        'x' => [ 1, 2, 3, 4, 5, 6, 7, 8, 9, 10, 11, ],
        'y' => [ 11, 8, 10, 7, 9, 6, 5, 3, 4, 2, 1, ],
    ],
    'Hugo' => [
        'x' => [ 1, 2, 3, 4, 5, 6, 7, 8, 9, 10, 11, ],
        'y' => [ 4, 8, 10, 1, 9, 6, 5, 3, 7, 1, 11, ],
    ],
    'Alex' => [
        'x' => [ 1, 2, 3, 4, 5, 6, 7, 8, 9, 10, 11, ],
        'y' => [ 3, 5, 11, 4, 8, 2, 9, 10, 1, 11, 7, ],
    ],
];

$conf = [
    //'canvasWidth' => 600,
    //'canvasHeight' => 500,
    'canvasBackgroundColor' => '#ccccff',
    //'frameXRatio' => 0.8,
    //'frameYRatio' => 0.7,
    //'axisColor' => '#666666',
    //'axisWidth' => 1,
    'gridColor' => '#999999',
    //'gridWidth' => 1,
    'gridXPitch' => 2,
    'gridYPitch' => 2,
    'gridX' => true,
    'gridY' => true,
    'xLimitUpper' => 12,
    'xLimitLower' => 0,
    'yLimitUpper' => 12,
    'yLimitLower' => 0,
    'plotDiameter' => 6,
    //'fontPath' => '/usr/share/fonts/opentype/ipafont-gothic/ipagp.ttf',
    //'fontSize' => 16,
    //'fontColor' => '#333333',
    'referenceLineX' => true,
    'referenceLineXValue' => 1.5,
    'referenceLineXWidth' => 1,
    'referenceLineXColor' => '#009933',
    'referenceLineY' => true,
    'referenceLineYValue' => 1.5,
    'referenceLineYWidth' => 1,
    'referenceLineYColor' => '#009933',
    'specificationLimitX' => true,
    'specificationLimitXLower' => 0.5,
    'specificationLimitXUpper' => 11.5,
    'specificationLimitXWidth' => 1,
    'specificationLimitXColor' => '#ff00ff',
    'specificationLimitY' => true,
    'specificationLimitYLower' => 0.5,
    'specificationLimitYUpper' => 11.5,
    'specificationLimitYWidth' => 1,
    'specificationLimitYColor' => '#ff00ff',
    'regressionLine' => true,
    'regressionLineWidth' => 3,
    'labelX' => 'DATA X',
    'labelY' => 'DATA Y',
    'caption' => 'Adjusting the Display By Neon File',
    'legend' => true,
    'legends' => [ 'John', 'Jake', 'Hugo', 'Alex', ],
    'legendWidth' => 100,
    'legendFontSize' => 10,
    'colors' => [
        '#3333cc',
        '#cc3333',
        '#339933',
        '#33cccc',
        '#cc3333',
        '#ffcc33',
        '#cccc33',
        '#cc33cc',
    ],
    'regressionLineColors' => [
        '#2222cc',
        '#cc2222',
        '#22cc22',
        '#22cccc',
    ],
];

$sp = new Scatterplot();
$sp->layers($layers)
   ->config($conf)
   ->create(__DIR__ . '/img/AdjustDisplayByArray.png');
-
Result: examples/img/AdjustDisplayByArray.png

5.6. Transparent Background
-
PHP: examples/TransparentBackground.php
<?php

require_once __DIR__ . '/../vendor/autoload.php';

use Macocci7\PhpScatterplot\Scatterplot;

$layers = [
    'John' => [
        'x' => [ 1, 2, 3, 4, 5, 6, 7, 8, 9, 10, 11, ],
        'y' => [ 1, 2, 3, 4, 5, 8, 4, 7, 11, 9, 1, ],
    ],
    'Jake' => [
        'x' => [ 1, 2, 3, 4, 5, 6, 7, 8, 9, 10, 11, ],
        'y' => [ 11, 8, 10, 7, 9, 6, 5, 3, 4, 2, 1, ],
    ],
    'Hugo' => [
        'x' => [ 1, 2, 3, 4, 5, 6, 7, 8, 9, 10, 11, ],
        'y' => [ 4, 8, 10, 1, 9, 6, 5, 3, 7, 1, 11, ],
    ],
    'Alex' => [
        'x' => [ 1, 2, 3, 4, 5, 6, 7, 8, 9, 10, 11, ],
        'y' => [ 3, 5, 11, 4, 8, 2, 9, 10, 1, 11, 7, ],
    ],
];

$sp = new Scatterplot();
$sp->layers($layers)
   ->config(__DIR__ . '/AdjustDisplayByNeon.neon')
   ->config([
       // This results in transparent backgournd
       'canvasBackgroundColor' => null,
   ])
   ->create(__DIR__ . '/img/TransparentBackground.png');
-
Result: examples/img/TransparentBackground.png
5.7. Parsed Data
-
<?php

require_once __DIR__ . '/../vendor/autoload.php';

use Macocci7\PhpScatterplot\Analyzer;

$a = new Analyzer();

$layers = [
    'John' => [
        'x' => [1,2,3,4,5,6,7,8,9,10,11],
        'y' => [1,2,3,4,5,8,4,7,11,9,1],
    ],
    'Jake' => [
        'x' => [1,2,3,4,5,6,7,8,9,10,11],
        'y' => [11,8,10,7,9,6,5,3,4,2,1],
    ],
];

var_dump($a->parse($layers));
-
Result: examples/ParsedData.txt
array(2) {
  ["John"]=>
  array(6) {
    ["count"]=>
    int(11)
    ["x"]=>
    array(5) {
      ["Mean"]=>
      int(6)
      ["Max"]=>
      int(11)
      ["Min"]=>
      int(1)
      ["Variance"]=>
      int(10)
      ["StandardDeviation"]=>
      float(3.1622776601683795)
    }
    ["y"]=>
    array(5) {
      ["Mean"]=>
      int(5)
      ["Max"]=>
      int(11)
      ["Min"]=>
      int(1)
      ["Variance"]=>
      float(10.181818181818182)
      ["StandardDeviation"]=>
      float(3.1908961408698624)
    }
    ["Covariance"]=>
    float(5.181818181818182)
    ["CorrelationCoefficient"]=>
    float(0.5135343537364686)
    ["RegressionLineFormula"]=>
    array(2) {
      ["a"]=>
      float(0.5181818181818182)
      ["b"]=>
      float(1.8909090909090907)
    }
  }
  ["Jake"]=>
  array(6) {
    ["count"]=>
    int(11)
    ["x"]=>
    array(5) {
      ["Mean"]=>
      int(6)
      ["Max"]=>
      int(11)
      ["Min"]=>
      int(1)
      ["Variance"]=>
      int(10)
      ["StandardDeviation"]=>
      float(3.1622776601683795)
    }
    ["y"]=>
    array(5) {
      ["Mean"]=>
      int(6)
      ["Max"]=>
      int(11)
      ["Min"]=>
      int(1)
      ["Variance"]=>
      int(10)
      ["StandardDeviation"]=>
      float(3.1622776601683795)
    }
    ["Covariance"]=>
    float(-9.454545454545455)
    ["CorrelationCoefficient"]=>
    float(-0.9454545454545453)
    ["RegressionLineFormula"]=>
    array(2) {
      ["a"]=>
      float(-0.9454545454545455)
      ["b"]=>
      float(11.672727272727274)
    }
  }
}
6. Examples
-
BasicUsage.php >> results in BasicUsage.md
-
UsingLayers.php >> results in UsingLayers.md
-
AdjustDisplayByMethods.php >> results in AdjustDisplayByMethods.md
-
AdjustDisplayByNeon.php >> results in:
-
AdjustDisplayByArray.php >> results in:
-
TransparentBackground.php >> results in:
-
ParsedData.php >> results in ParsedData.txt
-
Matrix.php >> results in Matrix.md