macocci7 / php-boxplot
PHP-Boxplot creates boxplots using FrequencyTable.
Maintainers
Requires
- php: >=8.3
- fakerphp/faker: ^1.24
- macocci7/php-frequency-table: ^1.4
- macocci7/php-plotter2d: ^1.0
- nette/neon: ^3.4
Requires (Dev)
- php-parallel-lint/php-parallel-lint: ^1.4
- phpstan/phpstan: ^2.1
- phpunit/phpunit: ^12.5
- squizlabs/php_codesniffer: ^4.0
README
1. Features
PHP-Boxplot is a PHP Library which is easy to use for creating boxplots.
Outlier Detection can be turned on/off.
Plotting Mean, Plotting Jitter and Plotting Outliers are available.
 |
 |
Multiple datasets can be displayed side by side at the same time.
Legends can also be displayed.

Transparent background is also supported.
![]()
Contents
3. Requirements
-
PHP 8.3 or later
-
Imagick PHP Extension
Check with commands:
(php -m; php -i) | grep imagick
-
Mbstring PHP Extension
Check with commands:
(php -m; php -i) | grep mbstring
4. Installation
composer require macocci7/php-boxplot
5. Usage
- 5.1. Basic Usage
- 5.2. Adjusting the Display By Methods
- 5.3. Multiple Data Set
- 5.4. Adjusting the Display By Neon File
- 5.5. Adjusting the Display By Array
- 5.6. Transparent Background
5.1. Basic Usage
-
<?php

require_once __DIR__ . '/../vendor/autoload.php';

use Macocci7\PhpBoxplot\Boxplot;

$data = [
    '1st' => [ 75, 82, 96, 43, 78, 91, 84, 87, 93, ],
    '2nd' => [ 66, 74, 62, 100, 72, 68, 59, 76, 65, ],
    '3rd' => [ 56, 0, 45, 76, 58, 52, 13, 48, 54, 68, ],
    '4th' => [ 68, 32, 56, 92, 67, 72, 45, 76, 48, 73, ],
    '5th' => [ 70, 58, 62, 88, 62, 68, 56, 63, 64, 78, ],
];

$bp = new Boxplot();

$bp->setData($data)
   ->create(__DIR__ . '/img/BasicUsage.png');
-
Result:
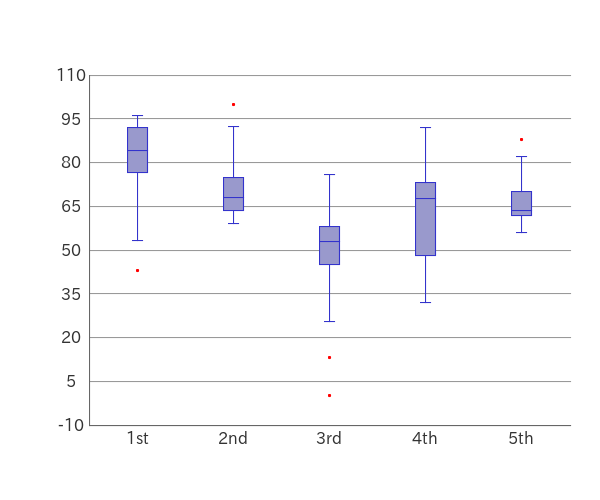
Outlier Detectionis enabled by default.Outliersare plotted as red dods.- The
Scale Rangeis 10% larger than theData Range. - Horizontal grid lines are drawn at intervals of 10% of the
Scale Range. - The hash keys of the data are used as the labels for the X axis.
-
Details:
- Import Autoloader:
require_once __DIR__ . '/../vendor/autoload.php' - Declare:
use Macocci7\PhpBoxplot\Boxplot - Instantiate:
new Boxplot() - Set Data:
setData($data)- Acceptable Data Type:
array<int|string, array<int|float>>
- Acceptable Data Type:
- Create Image:
create($path)
- Import Autoloader:

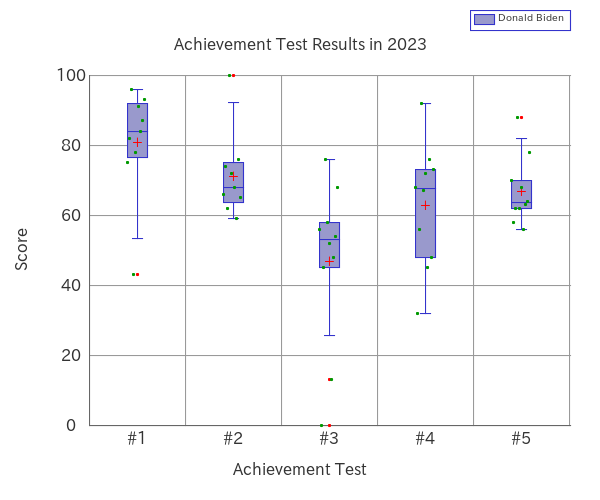
5.2. Adjusting the Display By Methods
Adjusting Scale Size, Grid Pitch, Showing Vertical Grids,
Setting Labels for Each Boxplot, Labels for X Axis, Labels For Y Axis
And Setting Caption can be done as follows:
-
PHP:
<?php

require_once __DIR__ . '/../vendor/autoload.php';

use Macocci7\PhpBoxplot\Boxplot;

$data = [
    '1st' => [ 75, 82, 96, 43, 78, 91, 84, 87, 93, ],
    '2nd' => [ 66, 74, 62, 100, 72, 68, 59, 76, 65, ],
    '3rd' => [ 56, 0, 45, 76, 58, 52, 13, 48, 54, 68, ],
    '4th' => [ 68, 32, 56, 92, 67, 72, 45, 76, 48, 73, ],
    '5th' => [ 70, 58, 62, 88, 62, 68, 56, 63, 64, 78, ],
];

$bp = new Boxplot();

$bp->setData($data)
   ->limit(0, 100)
   ->gridHeightPitch(20)
   ->gridVerticalOn()
   ->meanOn()
   ->jitterOn()
   ->legendOn()
   ->labels([ '#1', '#2', '#3', '#4', '#5', ])
   ->labelX('Achievement Test')
   ->labelY('Score')
   ->caption('Achievement Test Results in 2023')
   ->legends(['Donald Biden'])
   ->create(__DIR__ . '/img/AdjustDisplayByMethods.png');
-
Result:
-
Details:
-
Set Limits:
limit(int|float $lower, int|float $upper) -
Set Grid Pitch:
gridHeightPitch(int|float $pitch) -
Set Vertical Grid Visibility:
gridVerticalOn()gridVerticalOff()
-
Set Labels:
labels(string[] $labels) -
Set Label for X Axis:
labelX(string $labelX) -
Set Label for Y Axis:
labelY(string $labelY) -
Set Caption:
caption(string $caption) -
Available Methods:
Note:
$colorCodemust be in#RGBor#RRGGBBformat.Method Detail resize(int $width, int $height) Resizes Canvas Size bgcolor(string $colorCode) Sets Canvas Background Color fontColor(string $colorCode) Sets Font Color axisColor(string $colorCode) Sets Axis Color gridColor(string $colorCode) Sets Grid Color boxBorder(int $width, string $colorCode) Sets Box Border Color whisker(int $width, string $colorCode) Sets Whisker Width and Color gridHeightPitch(int|float $pitch) Sets Grid Pitch boxWidth(int $width) Sets Box Width boxBackground(array $colorCodes) Sets Box Background Color Set labels(array $labels) Sets Labels for Each Box labelX(string $label) Sets Label for X Axis labelY(string $label) Sets Label for Y Axis caption(string $caption) Sets Caption legends(array $legends) Sets Legend Labels legendBgcolor(string $colorCode) Sets Legends Area Background Color gridVerticalOn() Sets Visibility of Vertical Grid On gridVerticalOff() Sets Visibility of Vertical Grid Off outlierOn() Sets Outlier Detection On outlierOff() Sets Outlier Detection Off jitterOn() Sets Jitter Plot On jitterOff() Sets Jitter Plot Off meanOn() Sets Plotting Mean On meanOff() Sets Plotting Mean Off legendOn() Sets Displaying Legends On legendOff() Sets Displaying Legends Off
-

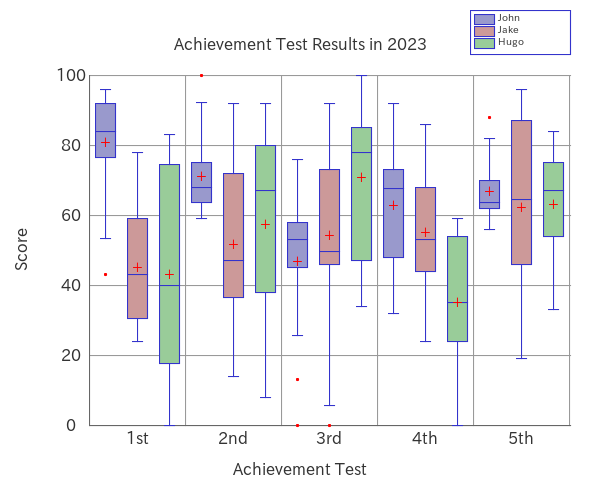
5.3. Multiple Data Set
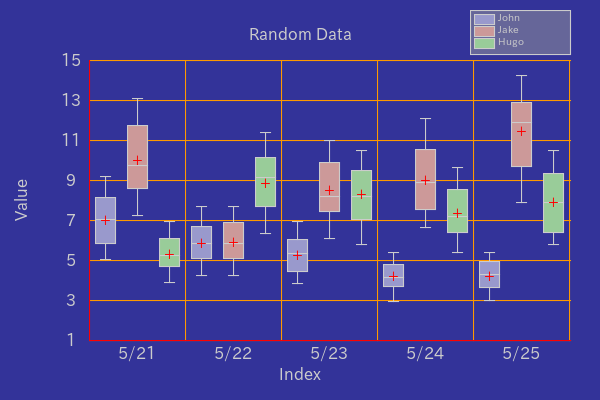
Multiple datasets can be displayed side by side at the same time.
-
PHP: examples/MultipleDataSet.php
<?php

require_once __DIR__ . '/../vendor/autoload.php';

use Macocci7\PhpBoxplot\Boxplot;

$dataSet = [
    'John' => [
        '1st' => [75, 82, 96, 43, 78, 91, 84, 87, 93, ],
        '2nd' => [66, 74, 62, 100, 72, 68, 59, 76, 65, ],
        '3rd' => [56, 0, 45, 76, 58, 52, 13, 48, 54, 68, ],
        '4th' => [68, 32, 56, 92, 67, 72, 45, 76, 48, 73, ],
        '5th' => [70, 58, 62, 88, 62, 68, 56, 63, 64, 78, ],
    ],
    'Jake' => [
        'test#1' => [62, 35, 48, 43, 56, 78, 32, 24, 29, ],
        'test#2' => [37, 92, 56, 36, 14, 86, 41, 58, 47, ],
        'test#3' => [49, 83, 0, 48, 64, 73, 50, 46, 38, 92, ],
        'test#4' => [53, 44, 34, 51, 74, 68, 53, 86, 24, 66, ],
        'test#5' => [83, 61, 55, 96, 87, 46, 21, 19, 88, 68, ],
    ],
    'Hugo' => [
        'test01' => [73, 36, 0, 11, 40, 76, 24, 46, 83, ],
        'test02' => [69, 42, 76, 8, 92, 84, 45, 34, 67, ],
        'test03' => [100, 46, 34, 77, 85, 47, 91, 85, 66, 79, ],
        'test04' => [0, 14, 32, 24, 54, 44, 56, 32, 59, 38, ],
        'test05' => [69, 84, 65, 42, 33, 80, 74, 54, 75, 56, ],
    ],
];

$bp = new Boxplot();
$bp->setDataset($dataSet)
   ->limit(0, 100)
   ->gridHeightPitch(20)
   ->gridVerticalOn()
   ->legendOn()
   ->meanOn()
   ->labelX('Achievement Test')
   ->labelY('Score')
   ->caption('Achievement Test Results in 2023')
   ->create(__DIR__ . '/img/MultipleDataSet.png');
-
Result: examples/img/MultipleDataSet.png
-
Details:
- Set Data Set:
setDataset(array $dataSet)$dataSet:array<int|string, array<int|string, array<int|float>>>
- The result of
array_keys($dataSet)will be set as the legends.- In this case: [ 'John', 'Jake', 'Hugo', ] will be set as the legends.
- The result of
array_keys($dataSet[array_keys($dataSet)[0]])will be set as the labels.- In this case: [ '1st', '2nd', '3rd', '4th', '5th', ] will be set as the legends.
legends(array $legends)can overwrite legends.labels(array $labels)can overwrite labels.
- Set Data Set:

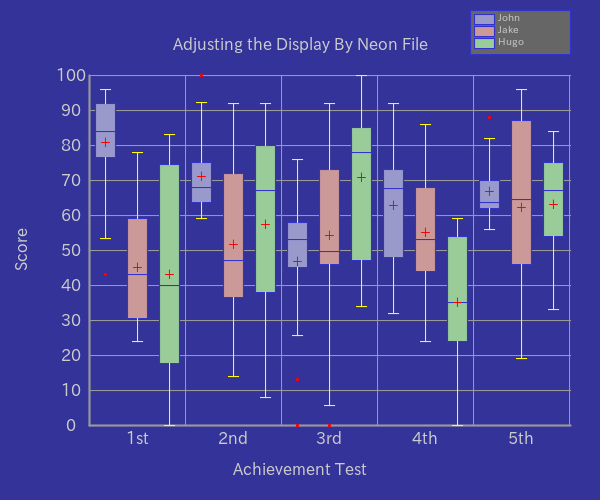
5.4. Adjusting the Display By Neon File
You can adjust the display by using Neon file.
First, prepare a Neon file like this:
-
Neon: examples/AdjustDisplayByNeon.neon
# Configuration for BoxplotExample.php

dataSet:
    'John': [
        1st: [75, 82, 96, 43, 78, 91, 84, 87, 93]
        2nd: [66, 74, 62, 100, 72, 68, 59, 76, 65]
        3rd: [56, 0, 45, 76, 58, 52, 13, 48, 54, 68]
        4th: [68, 32, 56, 92, 67, 72, 45, 76, 48, 73]
        5th: [70, 58, 62, 88, 62, 68, 56, 63, 64, 78]
    ]
    'Jake': [
        'test#1': [62, 35, 48, 43, 56, 78, 32, 24, 29]
        'test#2': [37, 92, 56, 36, 14, 86, 41, 58, 47]
        'test#3': [49, 83, 0, 48, 64, 73, 50, 46, 38, 92]
        'test#4': [53, 44, 34, 51, 74, 68, 53, 86, 24, 66]
        'test#5': [83, 61, 55, 96, 87, 46, 21, 19, 88, 68]
    ]
    'Hugo': [
        'test01': [73, 36, 0, 11, 40, 76, 24, 46, 83]
        'test02': [69, 42, 76, 8, 92, 84, 45, 34, 67]
        'test03': [100, 46, 34, 77, 85, 47, 91, 85, 66, 79]
        'test04': [0, 14, 32, 24, 54, 44, 56, 32, 59, 38]
        'test05': [69, 84, 65, 42, 33, 80, 74, 54, 75, 56]
    ]

limitUpper: 100
limitLower: 0

#canvasWidth: 600
#canvasHeight: 400
canvasBackgroundColor: '#333399'
#frameXRatio: 0.7
#frameYRatio: 0.6

axisColor: '#999999'
axisWidth: 2

#gridColor: '#cccccc'
#gridWidth: 1

gridHeightPitch: 10
gridVertical: true

#boxWidth: 20
#boxBackgroundColors:
#    - '#9999cc'
#    - '#cc9999'
#    - '#99cc99'
#    - '#99cccc'
#    - '#cc6666'
#    - '#ffcc99'
#    - '#cccc99'
#    - '#cc99cc'
#boxBorderColor: '#3333cc'
#boxBorderWidth: 1

whiskerColor: '#ffff00'
#whiskerWidth: 1

#fontPath: 'fonts/ipaexg.ttf' # IPA ex Gothic 00401
#fontSize: 16
fontColor: '#cccccc'

outlier: true
#outlierDiameter: 2
#outlierColor: '#ff0000'

#jitter: true
#jitterColor: '#009900'
#jitterDiameter: 2

mean: true
#meanColor: '#ff0000'

#labels: [ '1st', '2nd', '3rd', '4th', '5th' ]
labelX: 'Achievement Test'
labelY: 'Score'
caption: 'Adjusting the Display By Neon File'

legend: true
legendBackgroundColor: '#666666'
#legends: [ 'John', 'Jake', 'Hugo', ]
legendWidth: 100
legendFontSize: 10

# Default Color Set
#colors:
#    - '#9999cc'
#    - '#cc9999'
#    - '#99cc99'
#    - '#99cccc'
#    - '#cc6666'
#    - '#ffcc99'
#    - '#cccc99'
#    - '#cc99cc'
Second, Code PHP like this:
-
PHP: examples/AdjustDisplayByNeon.php
<?php

require_once __DIR__ . '/../vendor/autoload.php';

use Macocci7\PhpBoxplot\Boxplot;

$bp = new Boxplot();
$bp->config(__DIR__ . '/AdjustDisplayByNeon.neon')
   ->create(__DIR__ . '/img/AdjustDisplayByNeon.png');
Then, run the PHP Code.
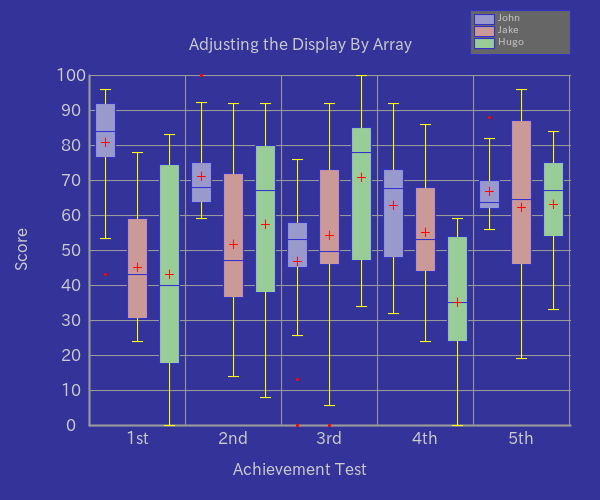
5.5. Adjusting the Display By Array
You can Adjust the Display by using Array.
-
PHP: examples/AdjustDisplayByArray.php
<?php

require_once __DIR__ . '/../vendor/autoload.php';

use Macocci7\PhpBoxplot\Boxplot;

$conf = [
    'dataSet' => [
        'John' => [
            '1st' => [75, 82, 96, 43, 78, 91, 84, 87, 93, ],
            '2nd' => [66, 74, 62, 100, 72, 68, 59, 76, 65, ],
            '3rd' => [56, 0, 45, 76, 58, 52, 13, 48, 54, 68, ],
            '4th' => [68, 32, 56, 92, 67, 72, 45, 76, 48, 73, ],
            '5th' => [70, 58, 62, 88, 62, 68, 56, 63, 64, 78, ],
        ],
        'Jake' => [
            'test#1' => [62, 35, 48, 43, 56, 78, 32, 24, 29, ],
            'test#2' => [37, 92, 56, 36, 14, 86, 41, 58, 47, ],
            'test#3' => [49, 83, 0, 48, 64, 73, 50, 46, 38, 92, ],
            'test#4' => [53, 44, 34, 51, 74, 68, 53, 86, 24, 66, ],
            'test#5' => [83, 61, 55, 96, 87, 46, 21, 19, 88, 68, ],
        ],
        'Hugo' => [
            'test01' => [73, 36, 0, 11, 40, 76, 24, 46, 83, ],
            'test02' => [69, 42, 76, 8, 92, 84, 45, 34, 67, ],
            'test03' => [100, 46, 34, 77, 85, 47, 91, 85, 66, 79, ],
            'test04' => [0, 14, 32, 24, 54, 44, 56, 32, 59, 38, ],
            'test05' => [69, 84, 65, 42, 33, 80, 74, 54, 75, 56, ],
        ],
    ],
    'limitUpper' => 100,
    'limitLower' => 0,
    'canvasBackgroundColor' => '#333399',
    'axisColor' => '#999999',
    'axisWidth' => 2,
    'gridHeightPitch' => 10,
    'gridVertical' => true,
    'whiskerColor' => '#ffff00',
    'fontColor' => '#cccccc',
    'outlier' => true,
    'mean' => true,
    'labelX' => 'Achievement Test',
    'labelY' => 'Score',
    'caption' => 'Adjusting the Display By Array',
    'legend' => true,
    'legendBackgroundColor' => '#666666',
    'legendWidth' => 100,
    'legendFontSize' => 10,
];

$bp = new Boxplot();
$bp->config($conf)
   ->create(__DIR__ . '/img/AdjustDisplayByArray.png');
-
Result: examples/img/AdjustDisplayByArray.png

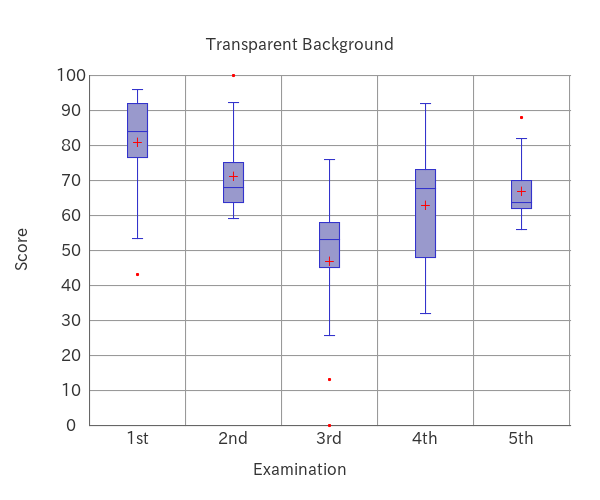
5.6. Transparent Background
You can set transparent background like this.
-
PHP: examples/TransparentBackground.php
<?php

require_once __DIR__ . '/../vendor/autoload.php';

use Macocci7\PhpBoxplot\Boxplot;

$data = [
    '1st' => [75, 82, 96, 43, 78, 91, 84, 87, 93],
    '2nd' => [66, 74, 62, 100, 72, 68, 59, 76, 65],
    '3rd' => [56, 0, 45, 76, 58, 52, 13, 48, 54, 68],
    '4th' => [68, 32, 56, 92, 67, 72, 45, 76, 48, 73],
    '5th' => [70, 58, 62, 88, 62, 68, 56, 63, 64, 78],
];

$bp = new Boxplot();

$bp->setData($data)
   ->config([
    // This results in Transparent Background
    'canvasBackgroundColor' => null,
])
   ->limit(0, 100)
   ->gridHeightPitch(10)
   ->gridVerticalOn()
   ->outlierOn()
   ->meanOn()
   ->labelX('Examination')
   ->labelY('Score')
   ->caption('Transparent Background')
   ->create(__DIR__ . '/img/TransparentBackground.png');
-
Result: examples/img/TransparentBackground.png
Examples
-
BasicUsage.php >> results in:
-
AdjustDisplayByMethods.php >> results in:
-
AdjustDisplayByNeon.php >> results in:
-
AdjustDisplayByArray.php >> results in:
-
MultipleDataSet.php >> results in:
-
TransparentBackground.php >> results in:
-
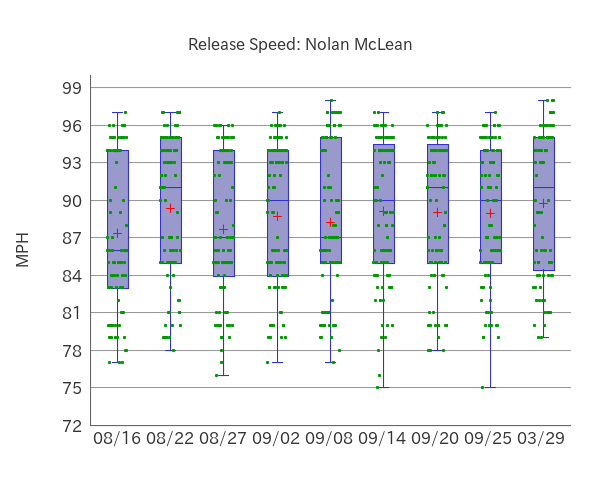
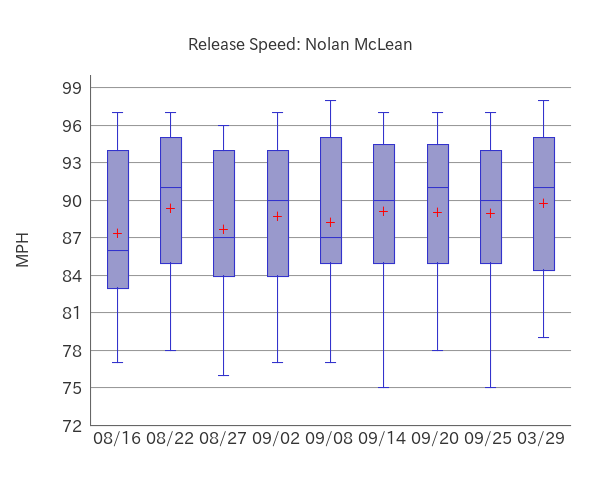
NolanMcLeanBoxplot2025.php >> results in:
-
BoxplotExampleCase.php >> results in:
