
astrophp / trail

Tracing, cost tracking, and an observability dashboard for the Laravel AI SDK.
Requires
- php: ^8.3
- illuminate/console: ^12.0|^13.0
- illuminate/contracts: ^12.0|^13.0
- illuminate/database: ^12.0|^13.0
- illuminate/http: ^12.0|^13.0
- illuminate/routing: ^12.0|^13.0
- illuminate/support: ^12.0|^13.0
- laravel/ai: ^1.1
Requires (Dev)
- larastan/larastan: ^3.0
- laravel/pint: ^1.26
- orchestra/testbench: ^10.6|^11.0
- pestphp/pest: ^4.0|^5.0
- pestphp/pest-plugin-laravel: ^4.0|^5.0
Suggests
None
Provides
None
Conflicts
None
Replaces
None
- dev-main
- v0.1.0
- dev-readme-design
- dev-release-fixes
- dev-keyboard-shortcuts
- dev-release-workflow
- dev-command-palette
- dev-trim-docs-tests
- dev-documentation
- dev-search-endpoint
- dev-install-test
- dev-overview-models
- dev-usage-chart
- dev-test-teardown-race
- dev-price-editor
- dev-usage-exports
- dev-usage-spend
- dev-usage-page
- dev-usage-endpoint
- dev-run-usage-summaries
This package is auto-updated.
Last update: 2026-10-10 14:47:25 UTC
README

Observability for the Laravel AI SDK.
Agent runs recorded in your own database and shown in your own app.

Install · Screenshots · What it does · What it does not do · Documentation
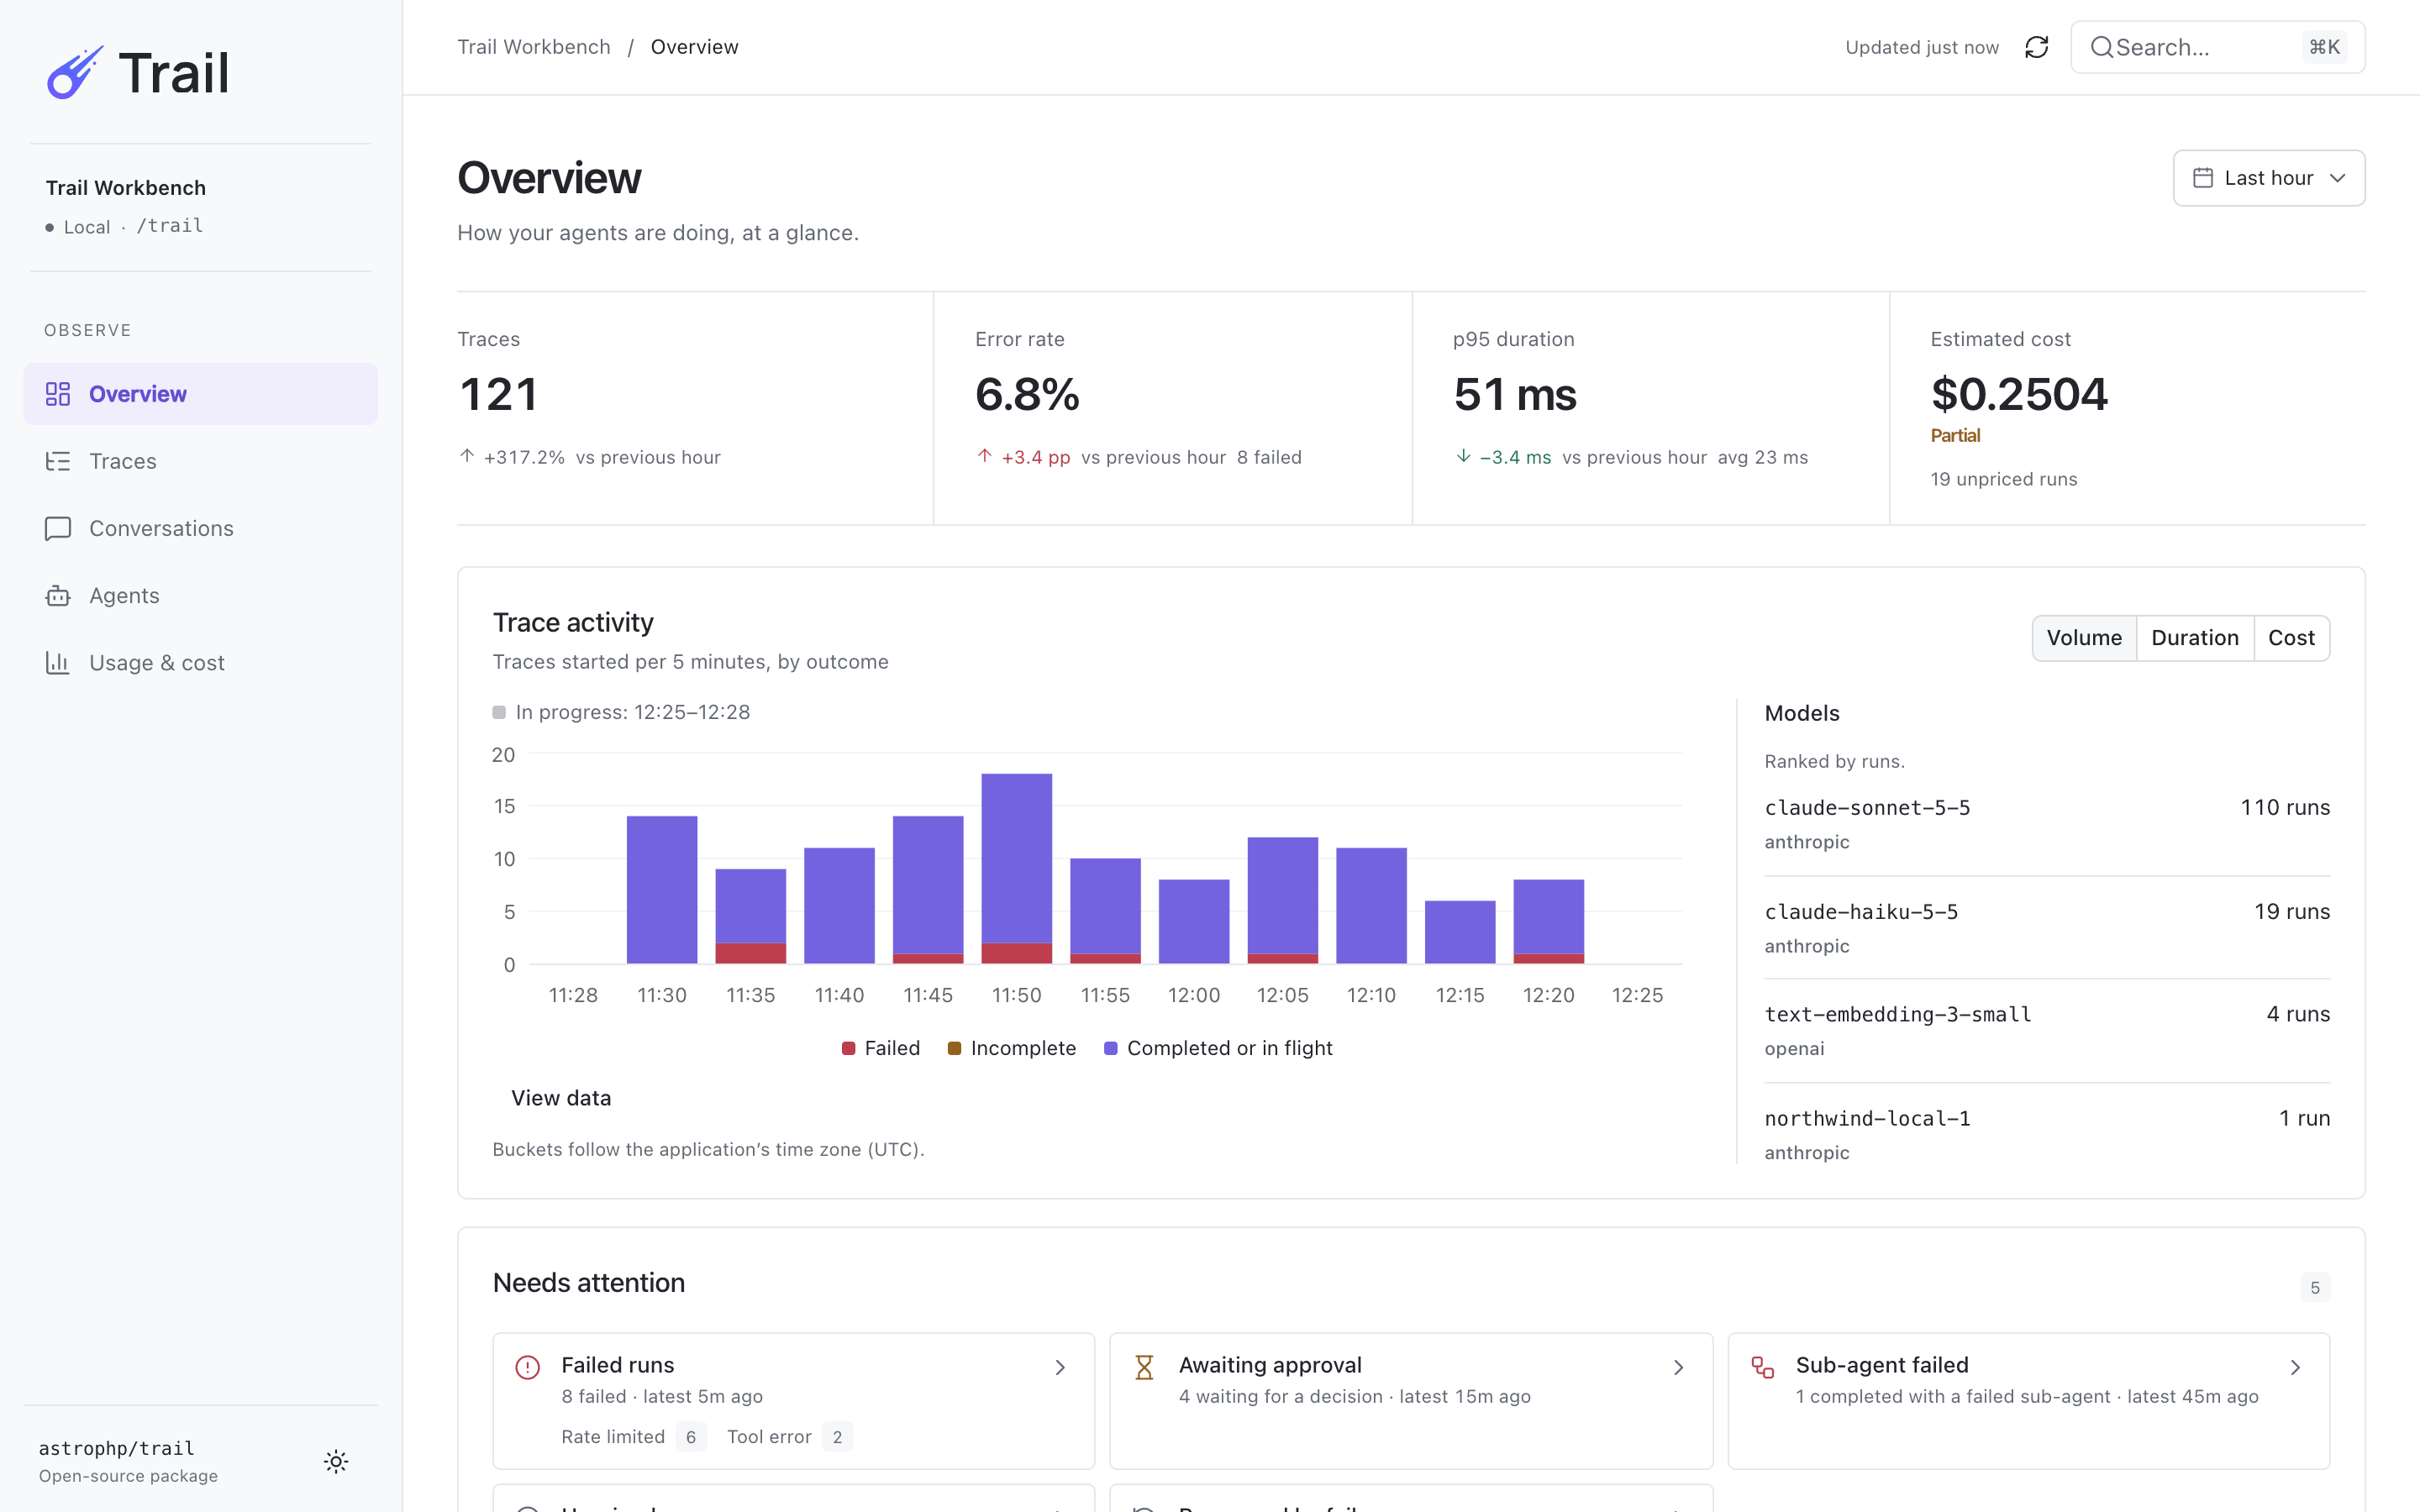
Trail records what your Laravel AI SDK agents did (runs, model steps, tool calls, sub-agents, tokens and estimated cost) into your application's own database. It serves a dashboard for those runs from your application, in the way Horizon and Telescope do. It is a package, not a hosted service: Trail stores recorded runs in your database and sends them to no service. Errors inside Trail go to your application's exception handler.
Requirements
- PHP 8.3 or newer
- Laravel 12 or 13
laravel/ai1.1 or newer- SQLite, MySQL or Postgres
Install
composer require astrophp/trail
php artisan migrate
That is all. Trail listens to the SDK's events, so your agents and tools need no change. Run an
agent as you already do, then open /trail in your application. In the local environment anyone
can open the dashboard.
To try it without calling a provider, use the SDK's own fake. In php artisan tinker, with
App\Ai\Agents\SupportAgent standing in for one of your agents:
App\Ai\Agents\SupportAgent::fake(['Hello from a fake provider.']);
(new App\Ai\Agents\SupportAgent)->prompt('Hi');
The run appears in the Traces list. A fake reports no token usage, so its tokens show as Not reported and its cost as Not captured.
Before production
Outside local, nobody can open the dashboard until you say who can. Publish the service provider:
php artisan trail:install
Then list who may pass in the viewTrail gate of app/Providers/TrailServiceProvider.php. See
Access. A request that fails the check gets a 403.
Trail deletes nothing until you run php artisan trail:prune, which removes traces older than 14
days by default. It never schedules its commands itself. See Operations.
What it looks like
These screenshots show runs that Trail recorded from the workbench, the small application in this repository that runs scripted agents.
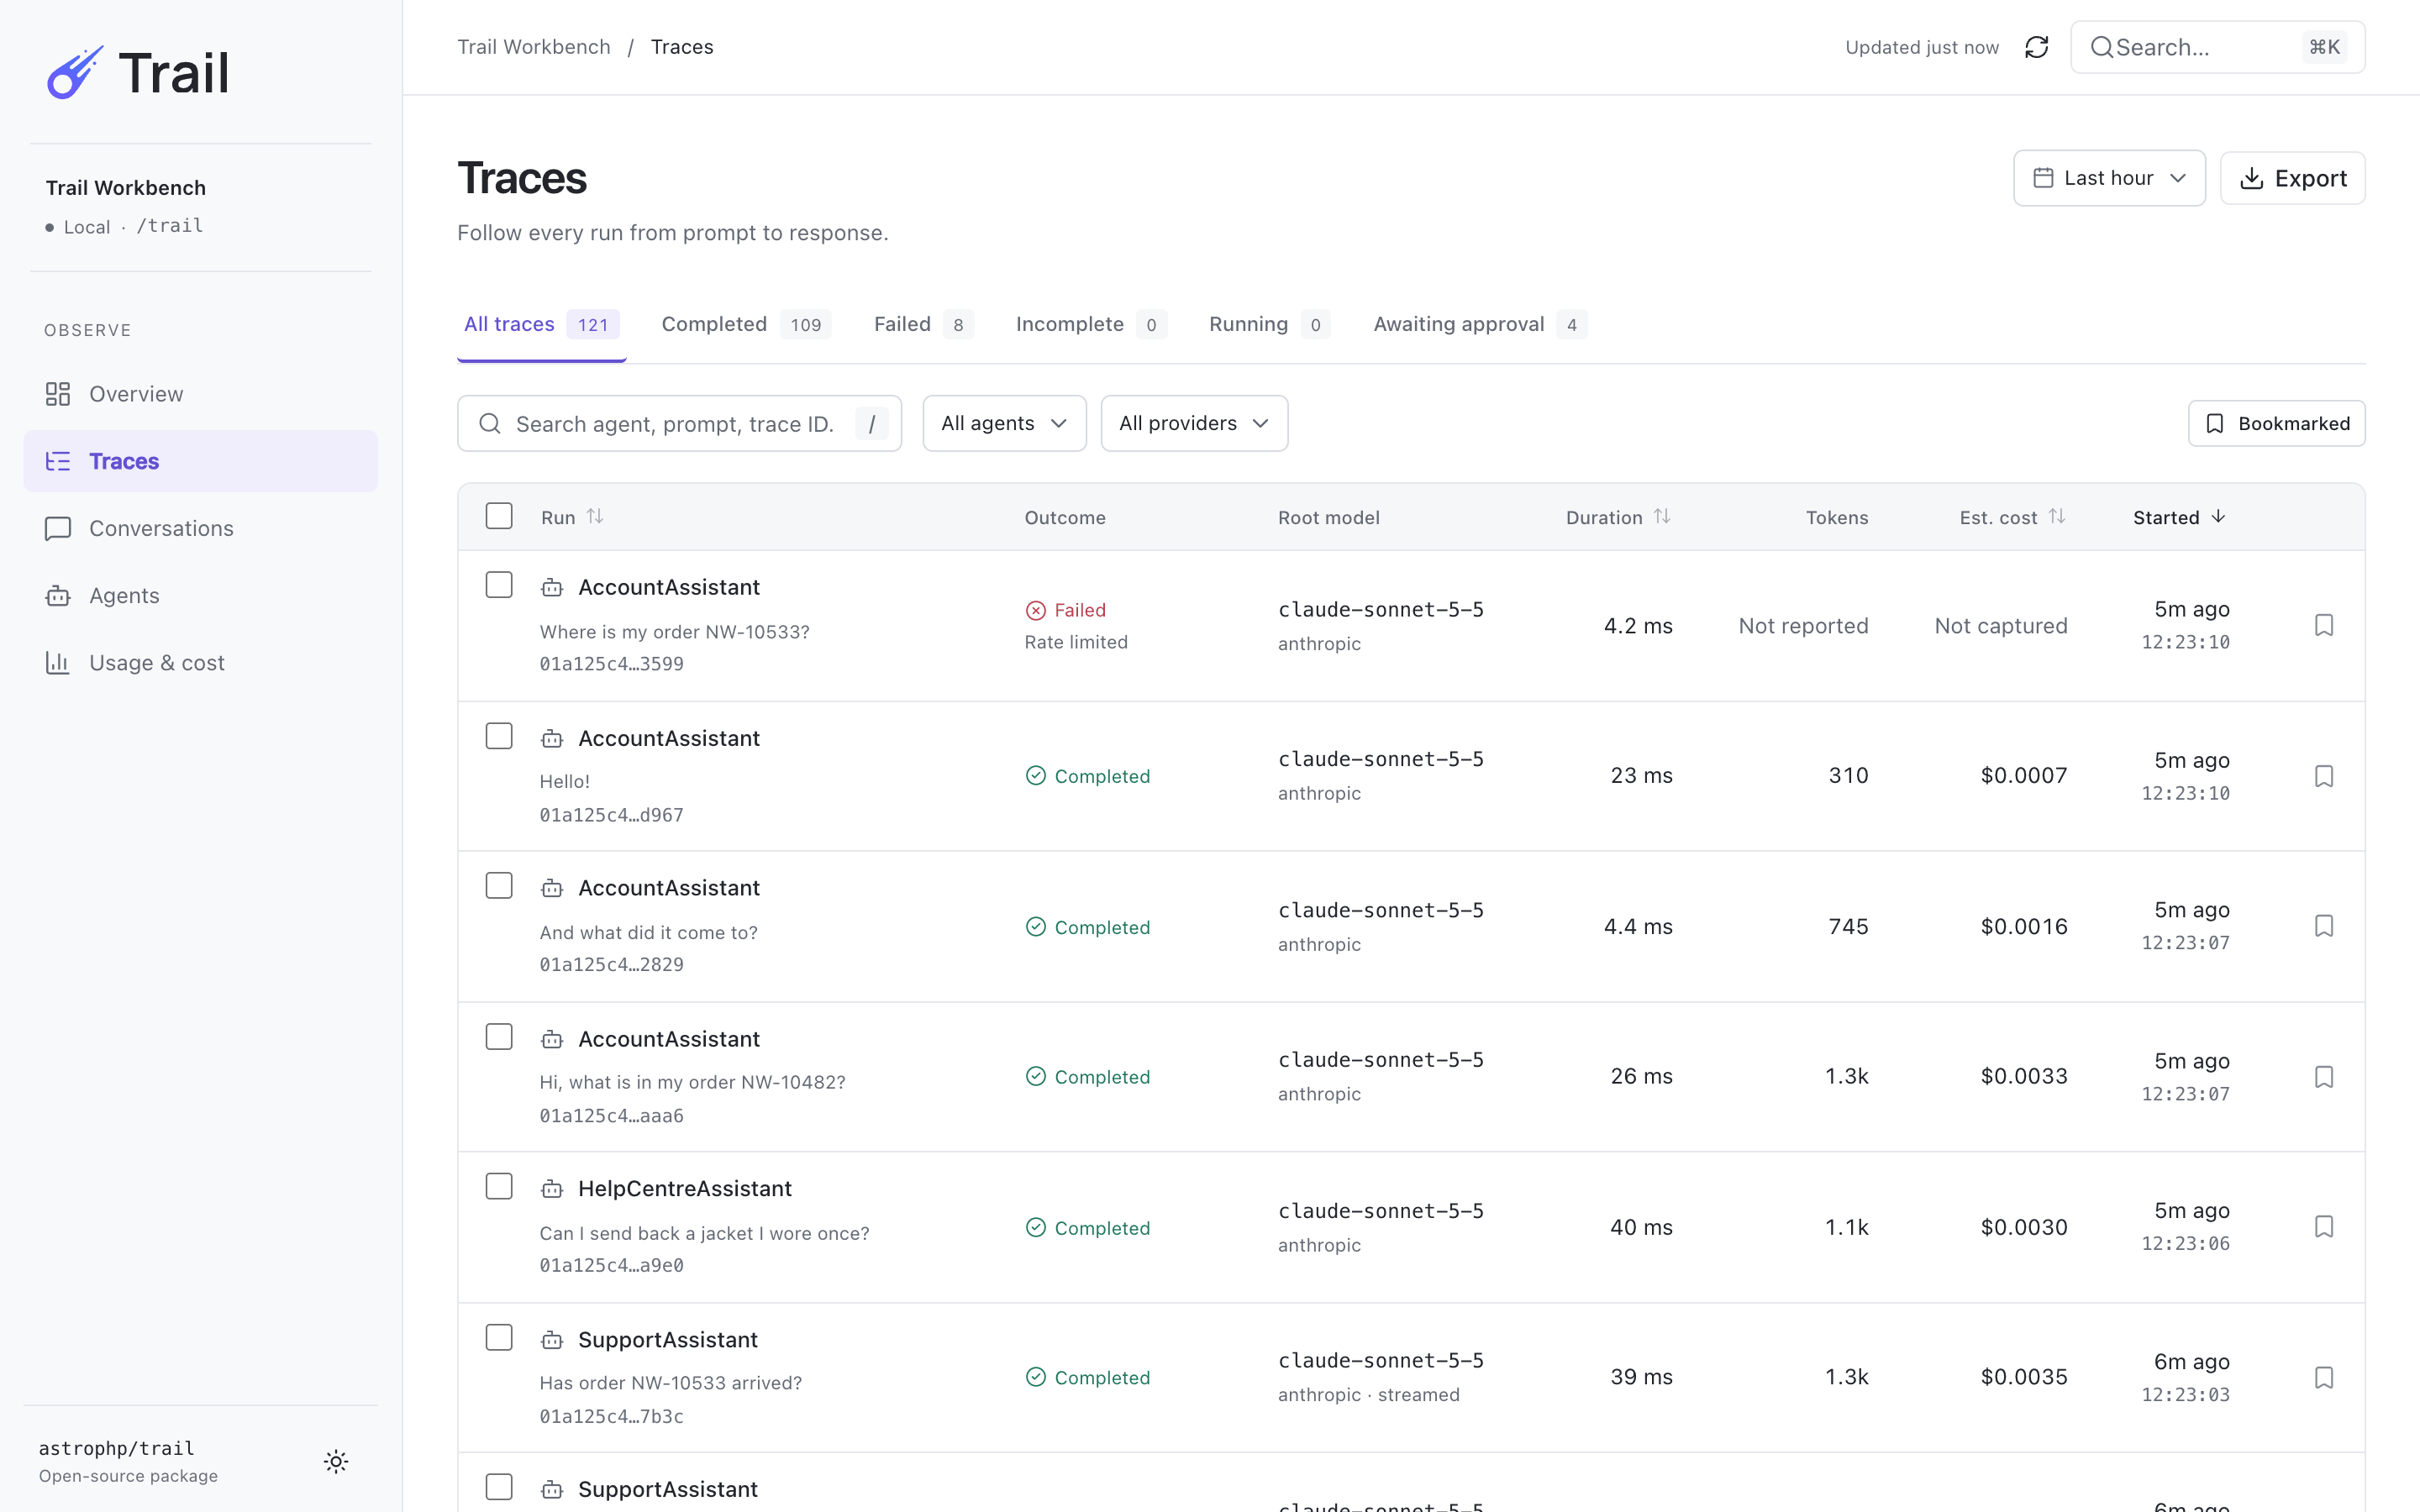
Traces. Every run, filterable, with comparison, bookmarks and export. |
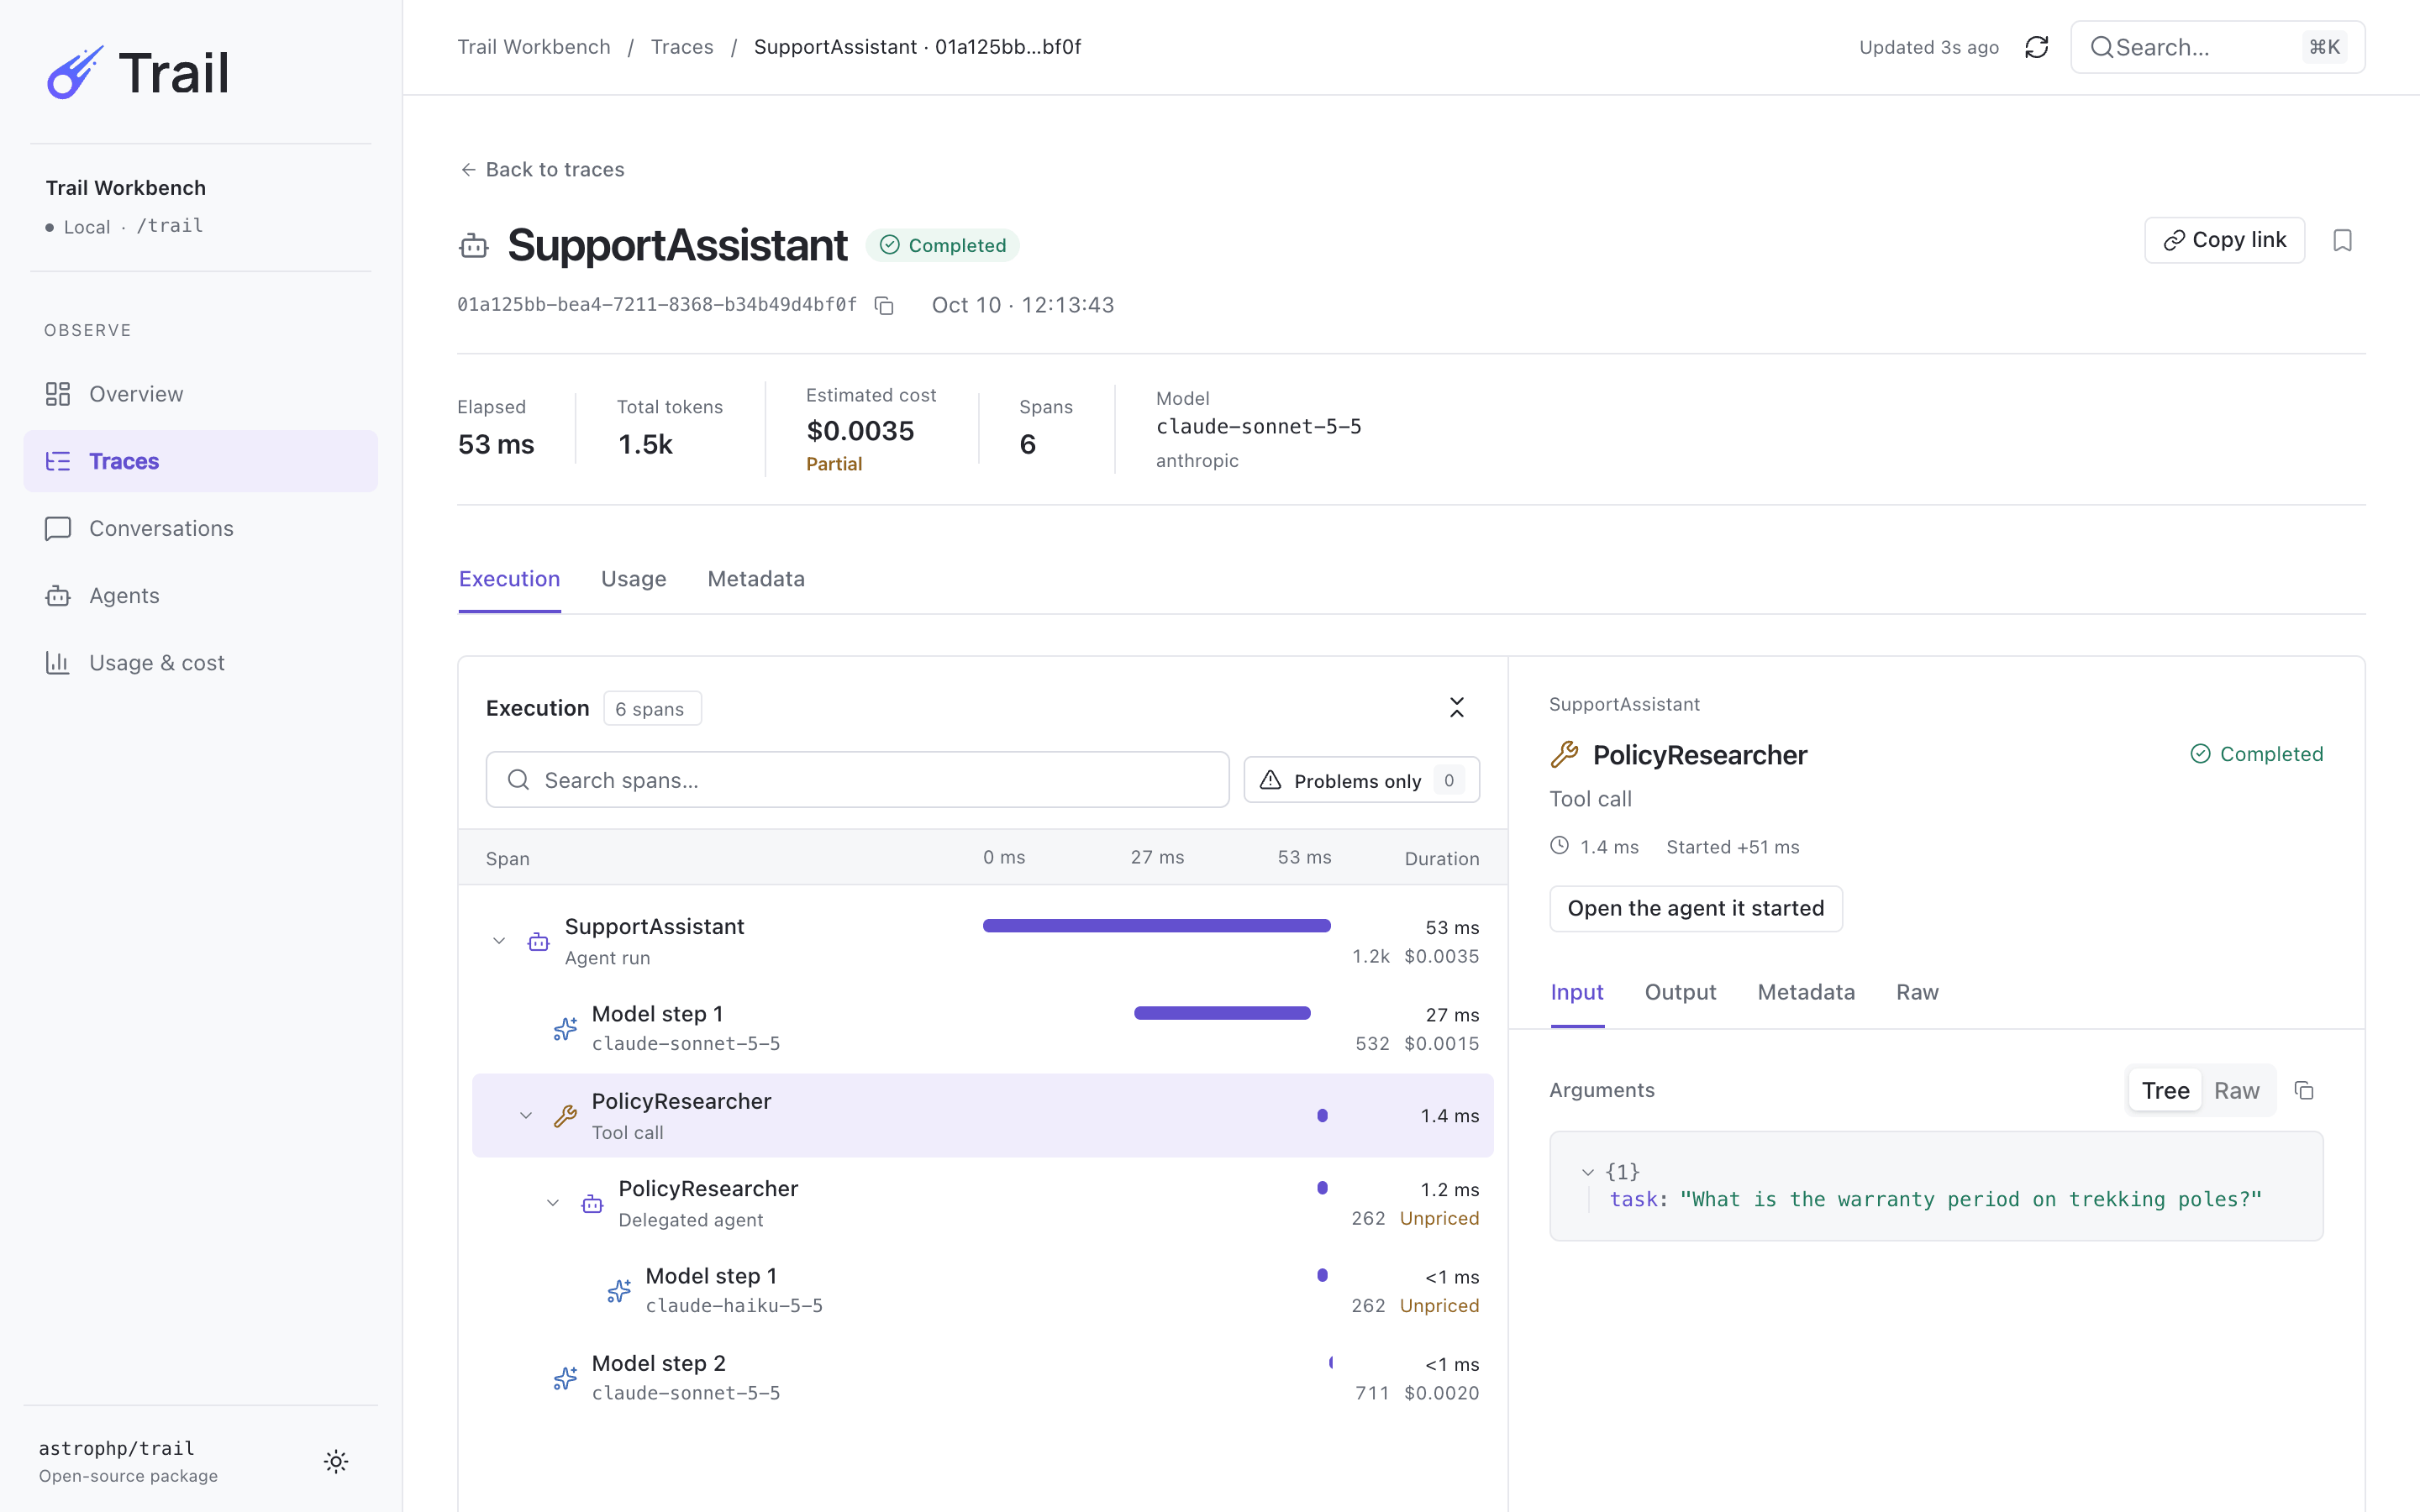
Trace inspector. The execution tree of one run with timing, and the evidence for the step you select. |
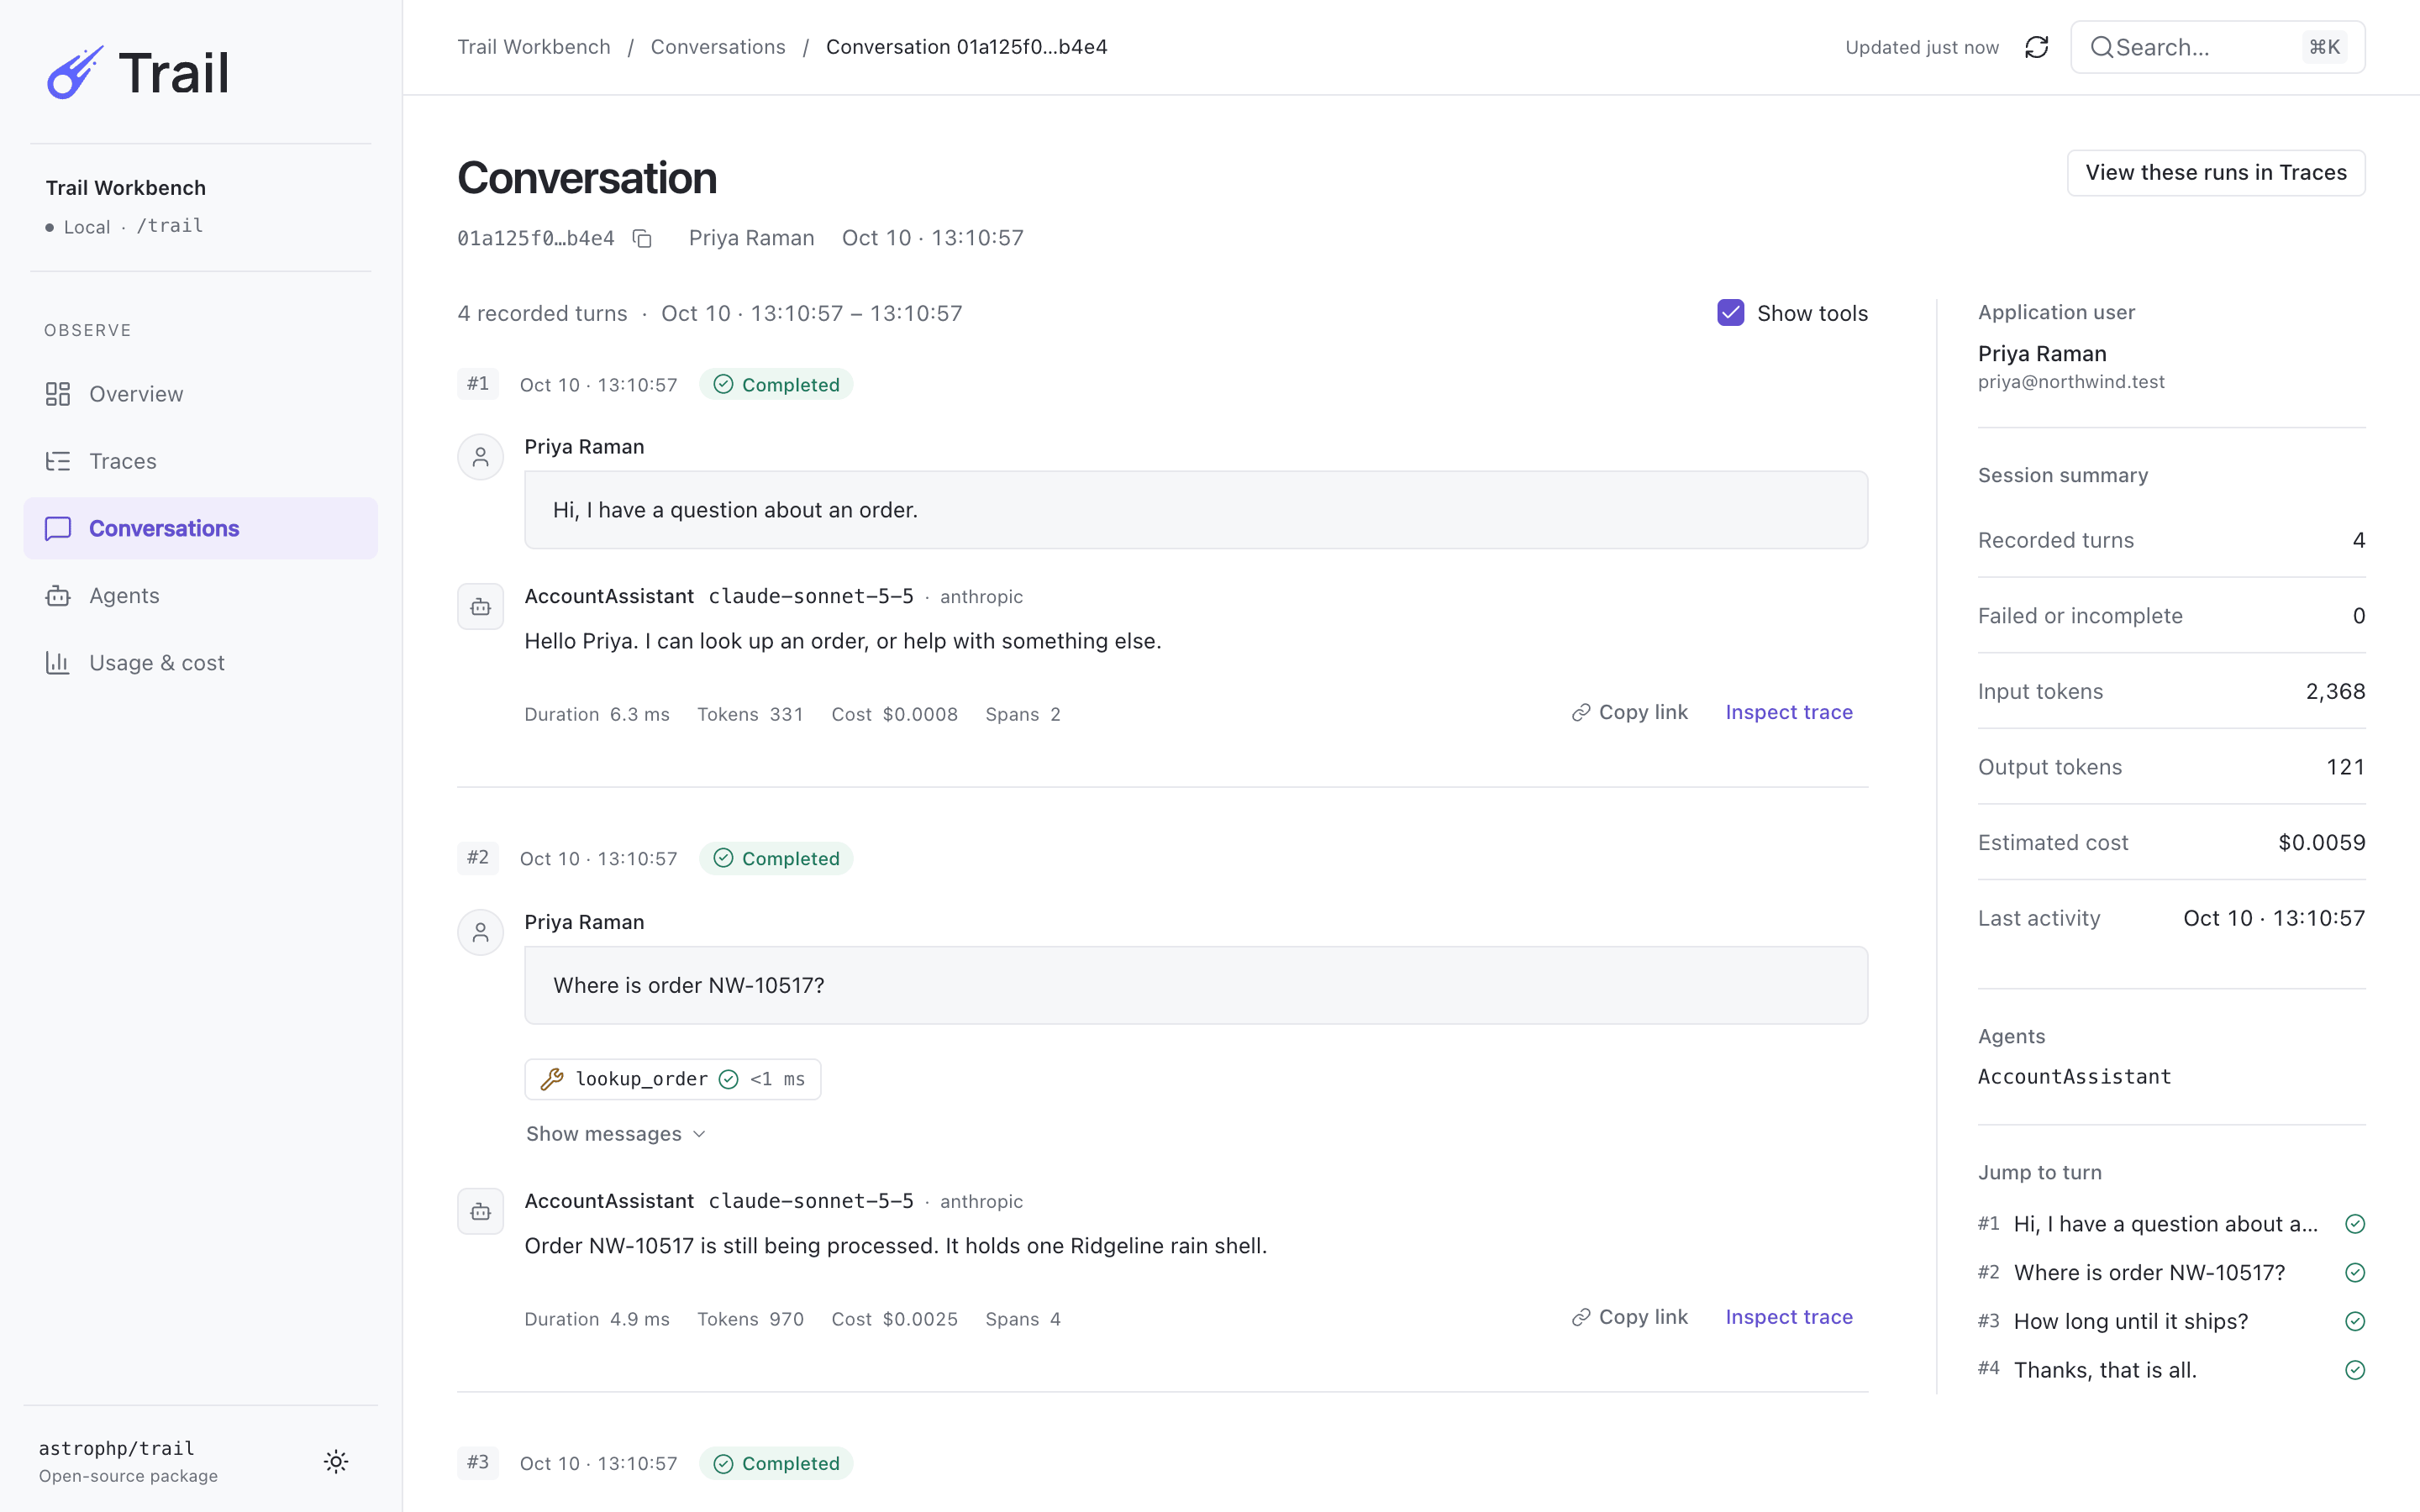
Conversations. A multi-turn session read as a transcript. |
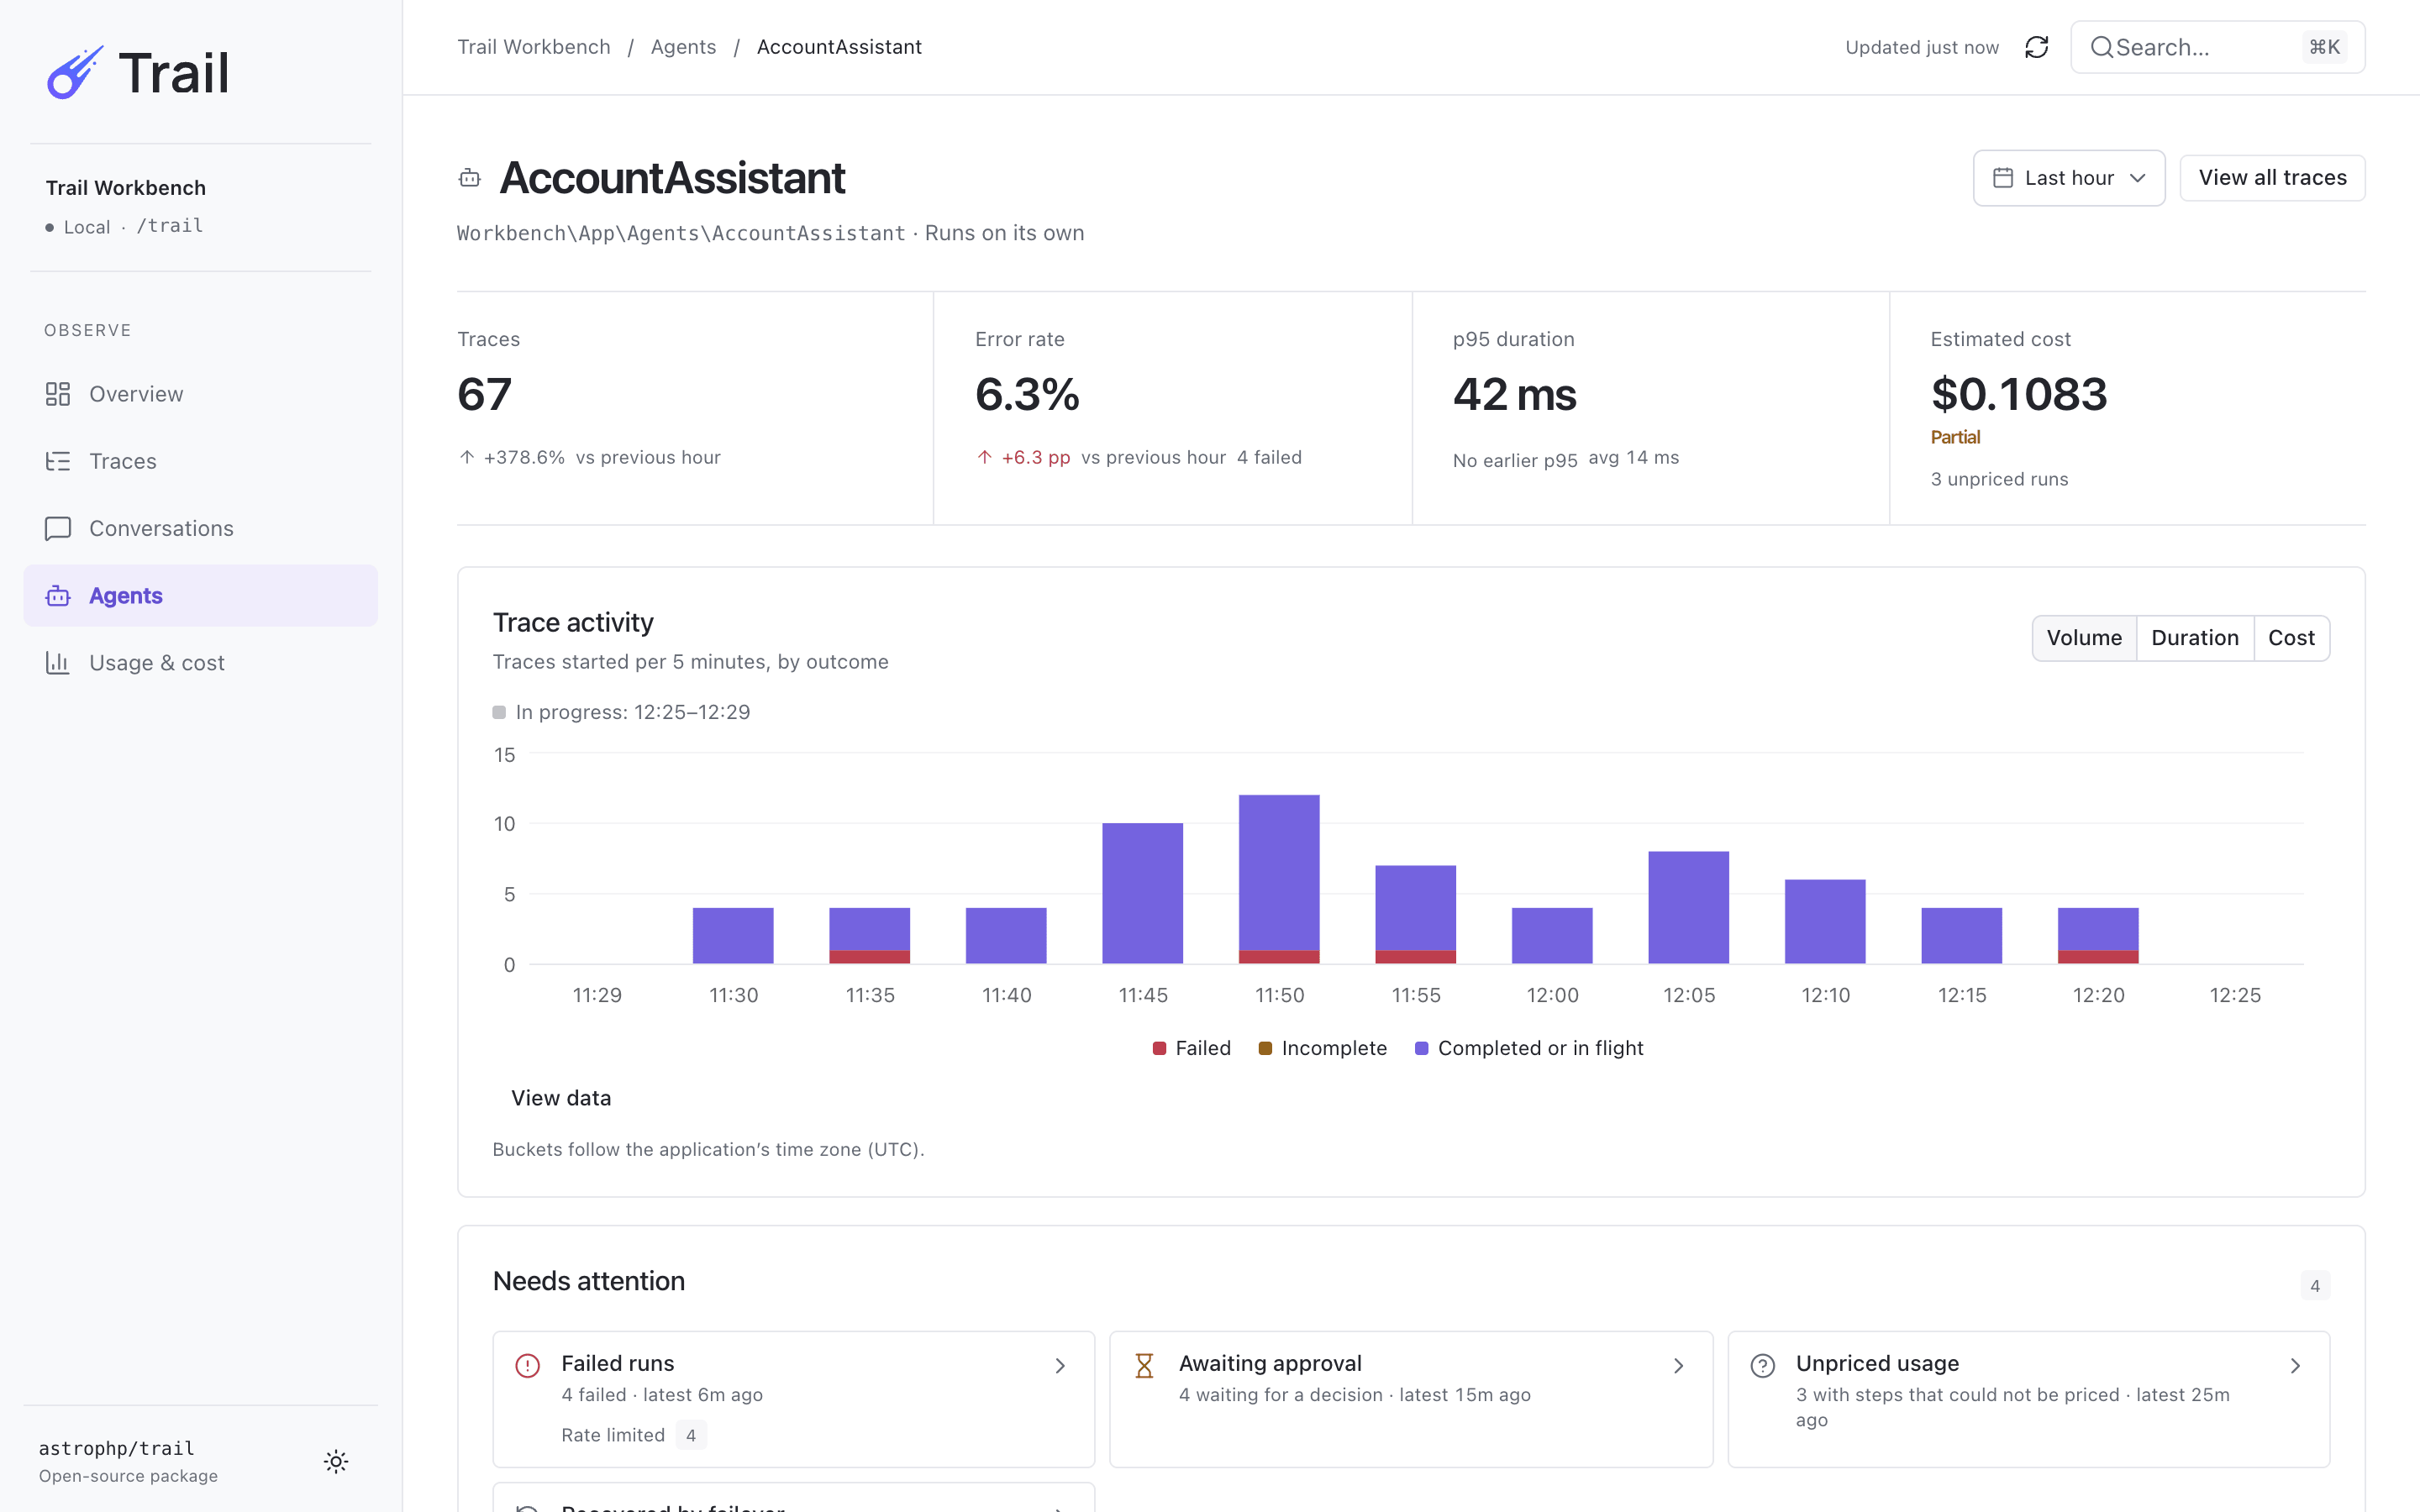
Agents. Reliability, latency and cost of one agent. |
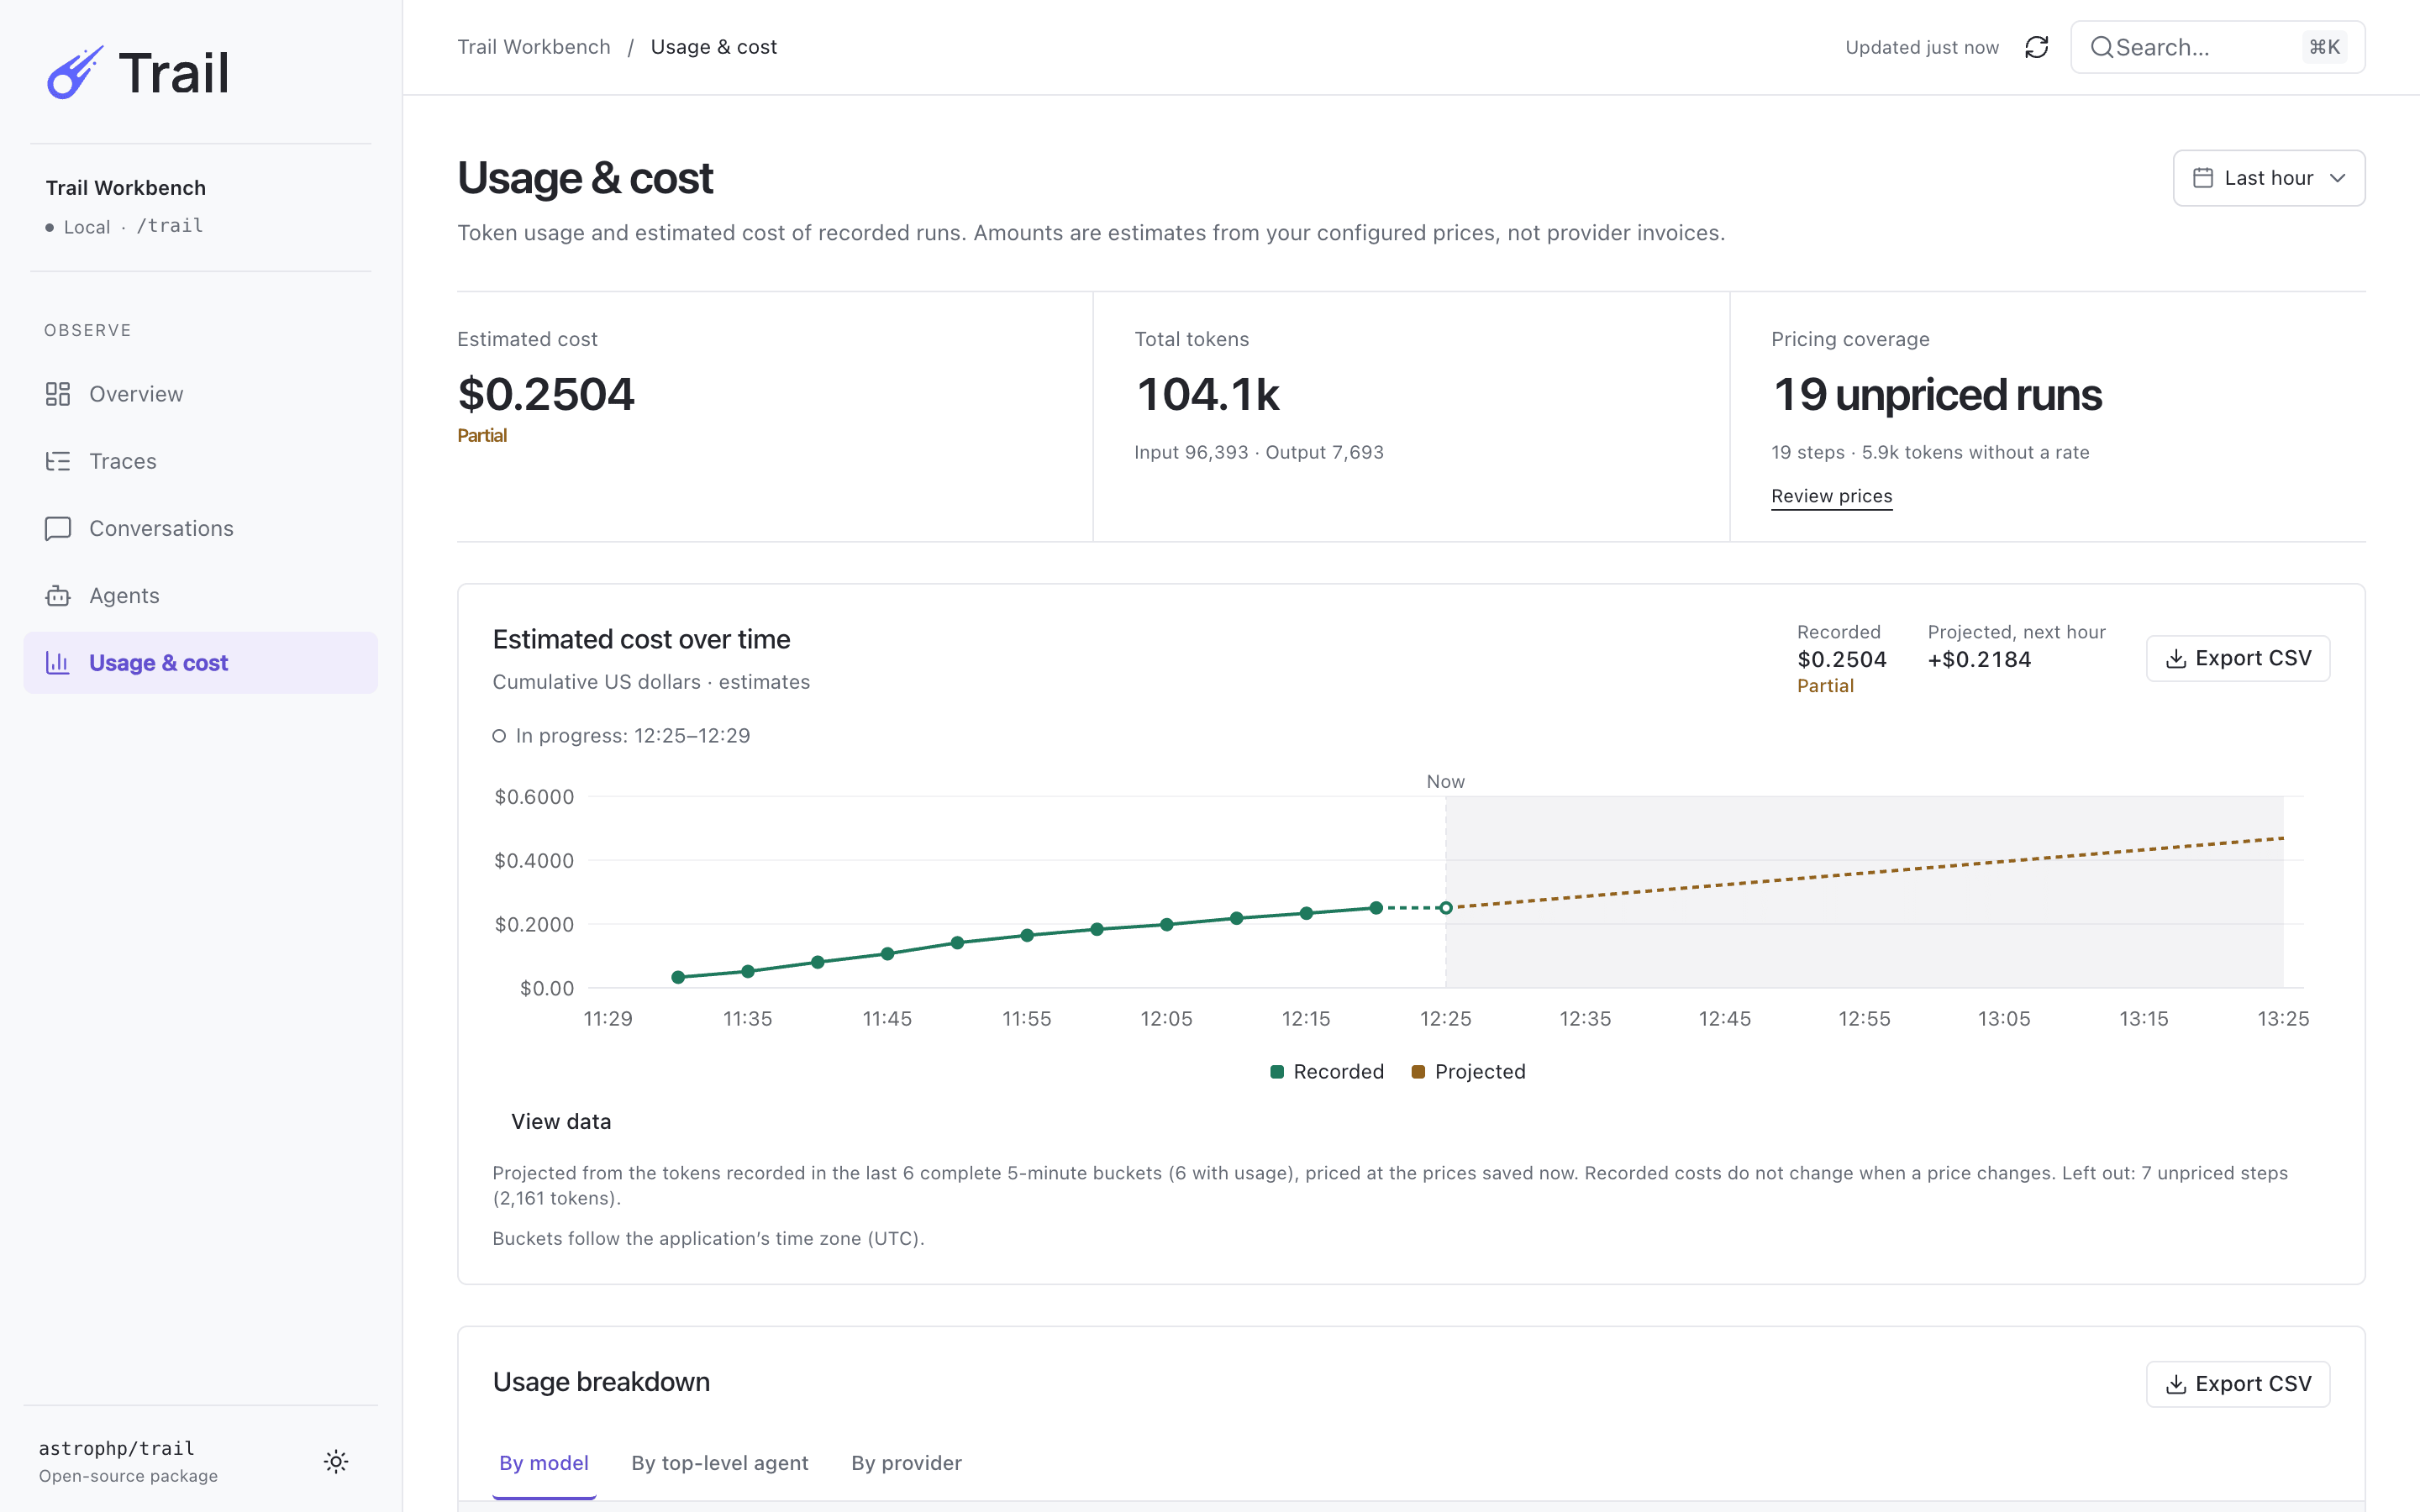
Usage & cost. Estimated spend over time, a projection, and breakdowns by model, provider and agent. |
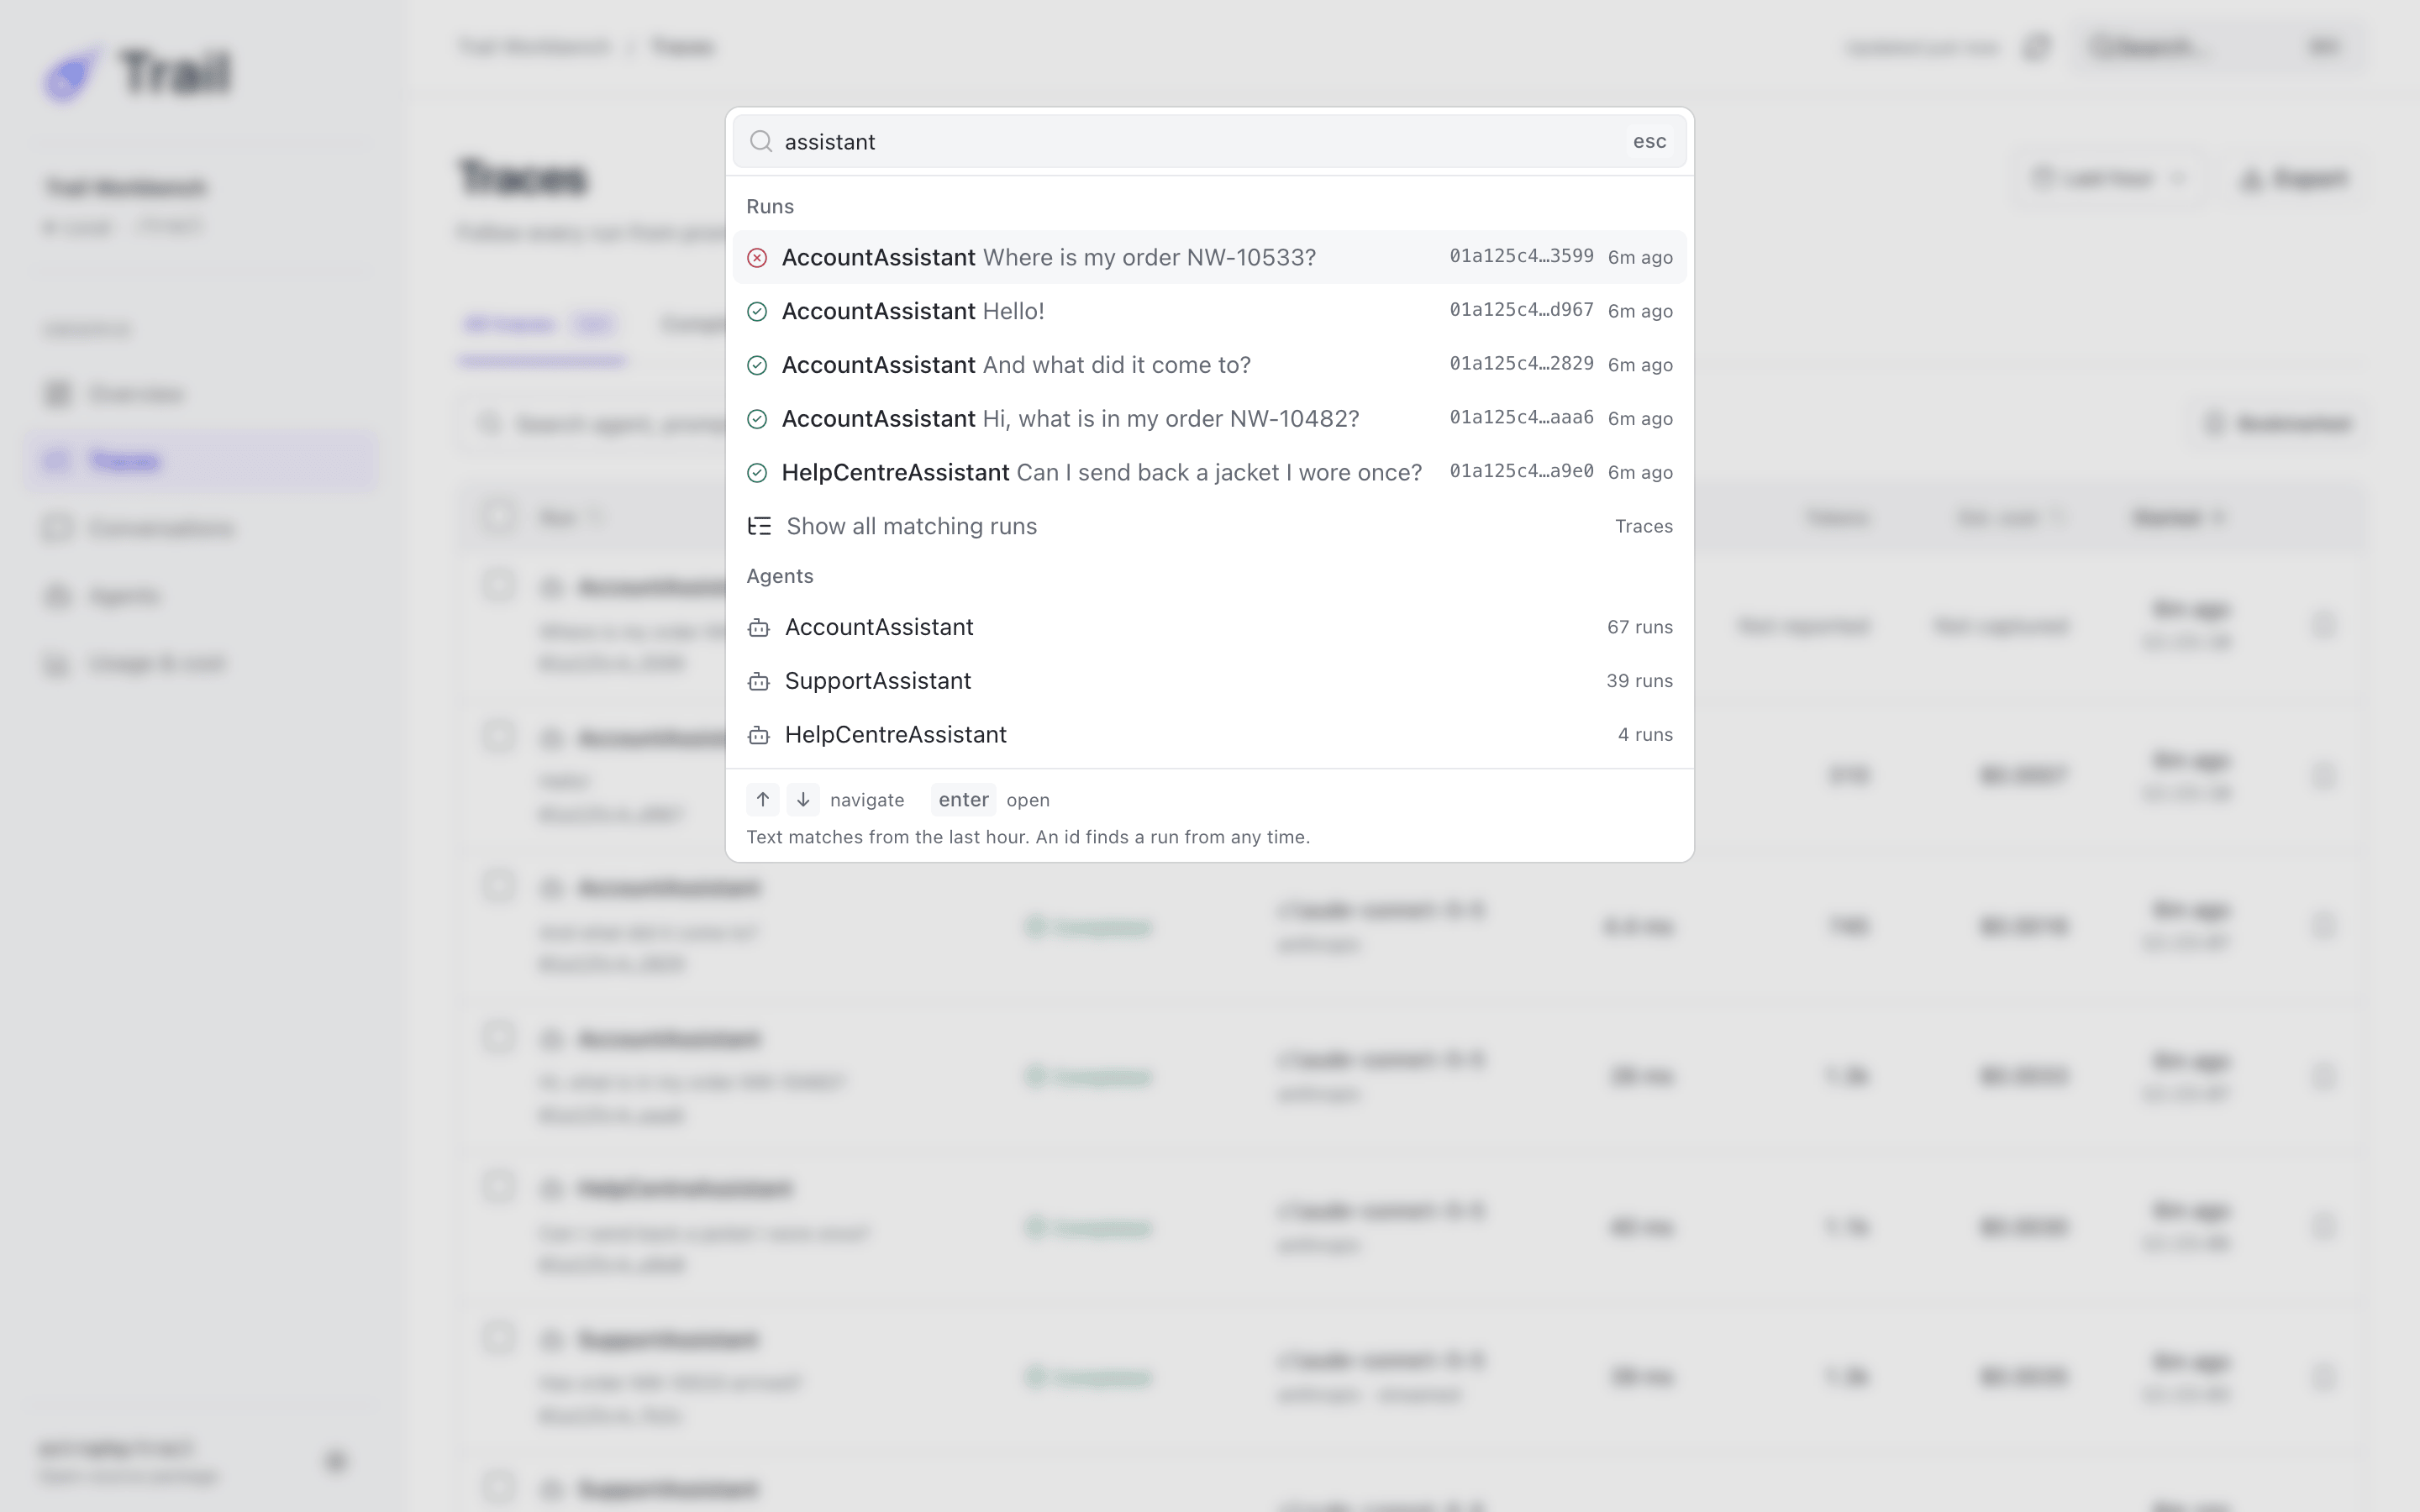
Command palette. Press ⌘K or Ctrl K to go to a page, or to find a run, a conversation or an agent. |
What it does
Capture
- Records agent runs, including streamed and queued ones, with their model steps, tool calls, sub-agents, embeddings, provider failover and tool-approval pauses, in one trace per run.
- Records real timing, token usage (cache and reasoning tokens included) and failure details, and
shows anything it could not capture as missing (
Not captured,Pending,Unpriced,Incomplete), never as zero. - Estimates cost from a price table in
config/trail.php. You can edit prices in the dashboard. A cost is an estimate, frozen when the run is recorded. It is not billing. - Redacts secrets and cuts long strings before storing anything, and can sample runs, filter them in code, or pause recording from the command line.
- Stores everything in your own database, on a connection you can choose.
Dashboard
- Serves a dashboard: an overview, a filterable list of runs with comparison, bookmarks and CSV export, the execution tree of each run, conversations as transcripts, per-agent reliability, latency and cost, and a usage and cost page with price management.
- Has a command palette on ⌘K or Ctrl K, to go to a page, copy the link or switch the theme, or
find a run, a conversation or an agent by text or id, and keyboard shortcuts that
?lists.
Operations
- Controls who can open the dashboard with a gate, and can switch recording or the dashboard off.
- Ships artisan commands to install, prune, sweep, clear, pause and resume. It never schedules them.
- Gives your own tests
Trail::fake()and its assertions.
What it does not do
- It is not billing, and its costs are estimates from list prices. The default prices use base rates and do not model long-context surcharges.
- It records agent runs and embeddings. It does not record classification, images, audio, transcription or reranking.
- It records only what the SDK reports through events. The extra model call that titles a new conversation, and embeddings served from the SDK's cache, are not recorded.
- A run that resumes a tool-approval pause is a separate trace from the run that paused. They are not linked.
- It does not find every secret. Redaction catches keys and recognisable token shapes, not a password written in a sentence.
- It has no users or accounts of its own, and no hosted version: access uses your application's gate.
- With SQLite and several writers, a trace can be lost. See Operations.
The full list is in Known limits.
Documentation
- Installation and upgrading
- Configuration: every key, its environment variable and default
- Access: the
viewTrailgate,Trail::auth(), guard, middleware, path and domain - What is recorded, and how to read what the dashboard shows
- Payloads and sampling: redaction, truncation,
Trail::filter(),Trail::withoutRecording() - Cost: how prices are found and why a cost is an estimate
- Operations: the artisan commands, scheduling, queues, Octane and storage
- Testing your application:
Trail::fake() - Known limits
- Roadmap and changelog
Contributing
See CONTRIBUTING.md for setup, the commands, and the workbench app that records scripted agent runs.
Security
Please see SECURITY.md.
License
MIT. See LICENSE.