reinanhs / sqlcommenter-hyperf
SQLCommenter implementation for Hyperf. SQLCommenter is a set of tools that augments SQL Statements with comments containing information about the code that caused its execution. These information can be action, controller, framework, db_driver and opentelemetry traceparent.
Requires
- php: >=8.1
- hyperf/config: ~3.1.0
- hyperf/database: ~3.1.0
- hyperf/db-connection: ~3.1.0
- hyperf/di: ~3.1.0
- hyperf/http-server: ~3.1.0
- hyperf/tracer: ~3.1.0
Requires (Dev)
- mockery/mockery: ^1.6
- phpunit/phpunit: ^10.5
README
Introduction
Sqlcommenter Hyperf is a library designed to automatically add comments to SQL queries executed by the Hyperf framework. These comments use the sqlcommenter format, which is understood by various database tools and services, providing enhanced insights and traceability for your application's database interactions.
Installation
You can install the library via Composer:
composer require reinanhs/sqlcommenter-hyperf
Add component configuration:
php bin/hyperf.php vendor:publish reinanhs/sqlcommenter-hyperf
Sample
See an example of a simple query being executed:
select *
from users
Using this package, comments like this will be added:
select *
from users /*framework='Hyperf',
application='hyperf-skeleton',
controller='UserController',
action='index',
route='%%2Fapi%%2Ftest',
db_driver='mysql',
traceparent='00-1cd60708968a61e942b5dacc2d4a5473-7534abe7ed36ce35-01'*/
By examining the above SQL statement and its comment in /*...*/, we can correlate and identify the fields in the
SQL query to our source code in Hyperf:
Table 1: Information about the description of each type of comment
| ORIGINAL FIELD | INTERPRETATION |
|---|---|
| framework='Hyperf' | The word “Hyperf” represents the framework that generated the query. |
| application='hyperf-skeleton' | The name of the project where the code was run. |
| controller='UserController' | Controller name in app/Controller. |
| action='index' | Name of the method that was called called by the controller. |
| route='%%2Fapi%%2Ftest' | The route used during the query call. |
| db_driver='mysql' | The name of the Hyperf database engine. |
| traceparent='00-1cd60708968a61e942b5dacc2d4a5473-7534abe7ed36ce35-01' | The W3C TraceContext Traceparent field of the OpenTelemetry trace. |
Various tools and services can interpret these comments, helping to correlate user code with SQL statements generated by the ORM, and can be examined in the database server logs. This provides better observability into your application state up to the database server.
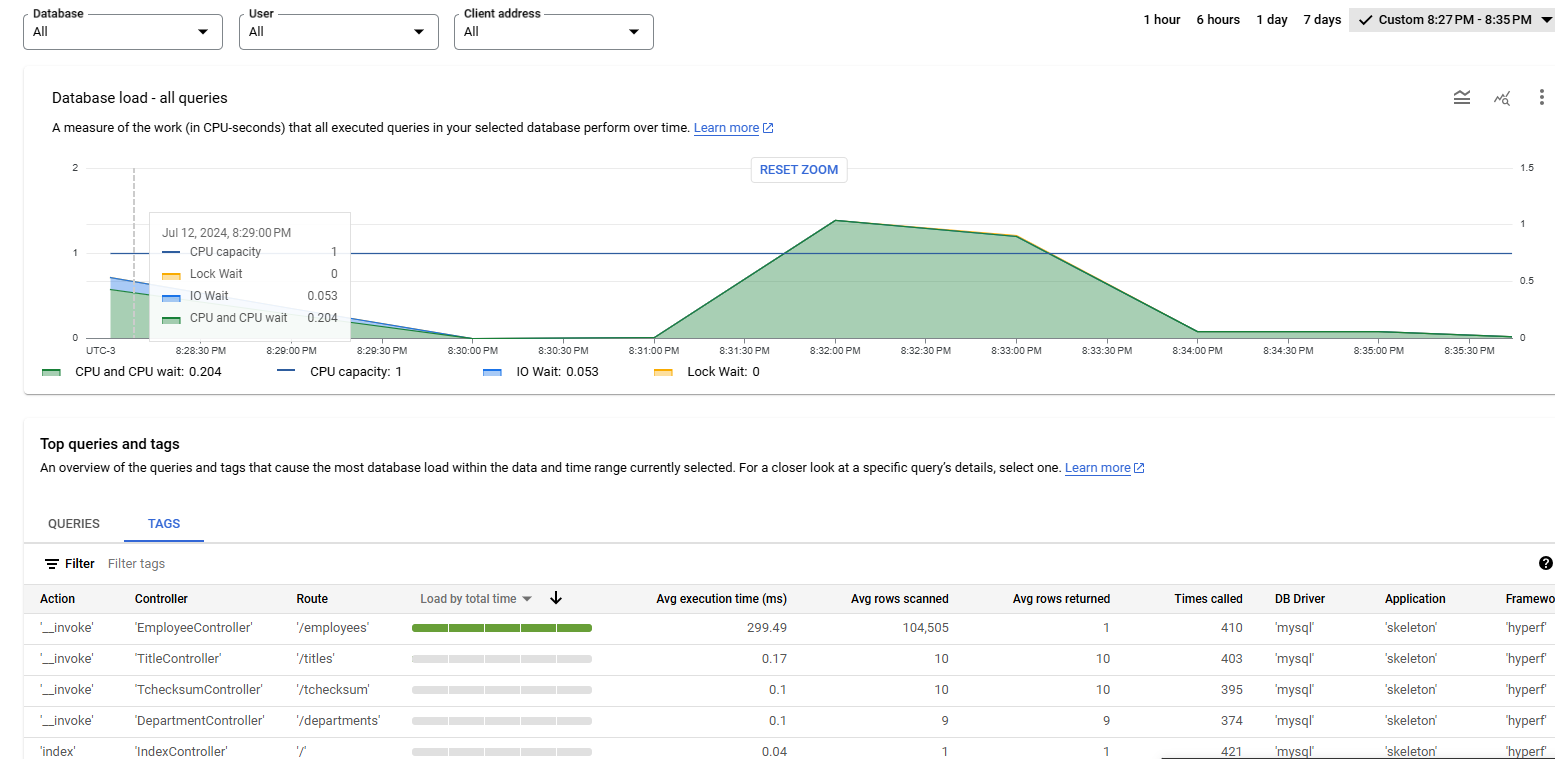
Here is an example of how this information appears within Google Cloud SQL:
The image above illustrates how sqlcommenter information is mapped within Google Cloud. In this context, sqlcommenter is being used to add tags in Query Insights, making it easier to identify which part of the application code is causing performance problems.
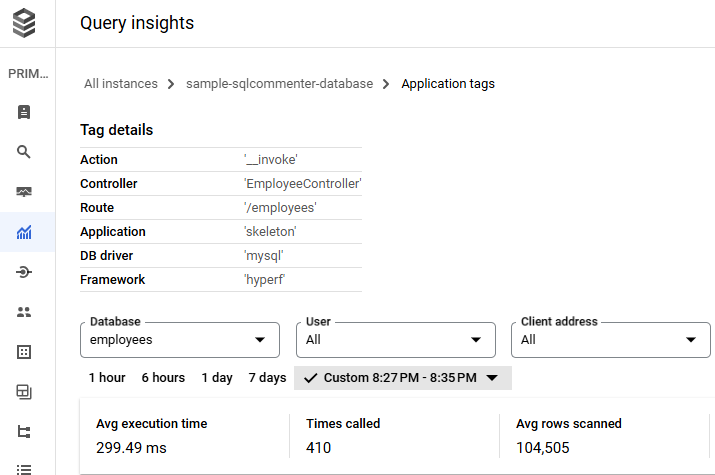
By clicking on one of these tags you will be able to view detailed information about the queries. See the example below:
In addition to Cloud SQL, several other tools also support sqlcommenter. One example is the Planetscale Query Insights.
Trace
By using the sqlcommenter-hyperf library, you can link Cloud SQL Query trace information with your Hyperf project. By synchronizing your information, you will achieve a much more detailed level of traceability than what is provided by Hyperf by default.
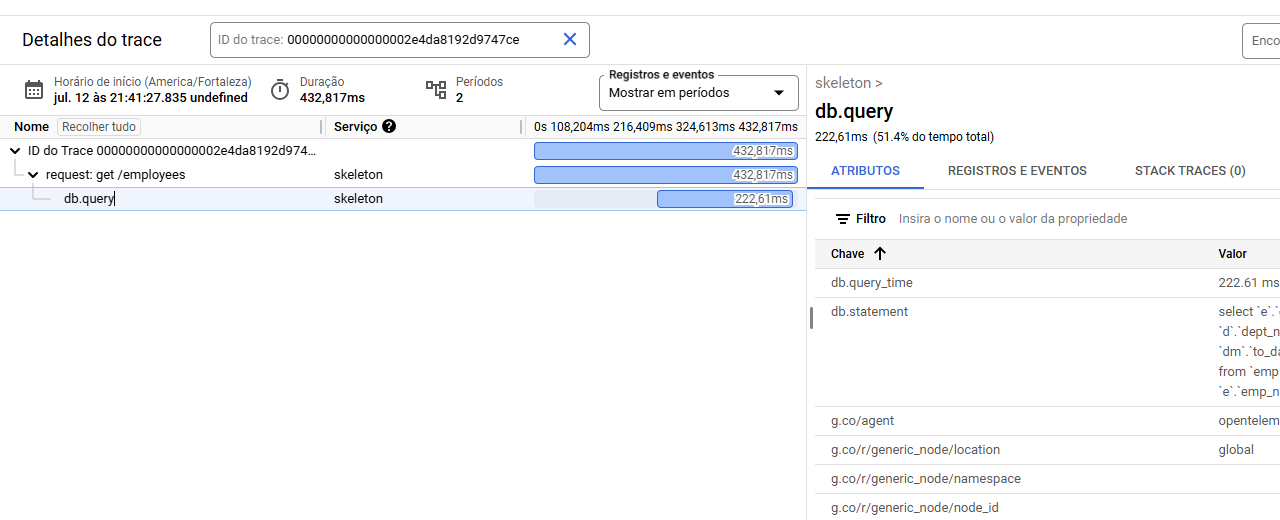
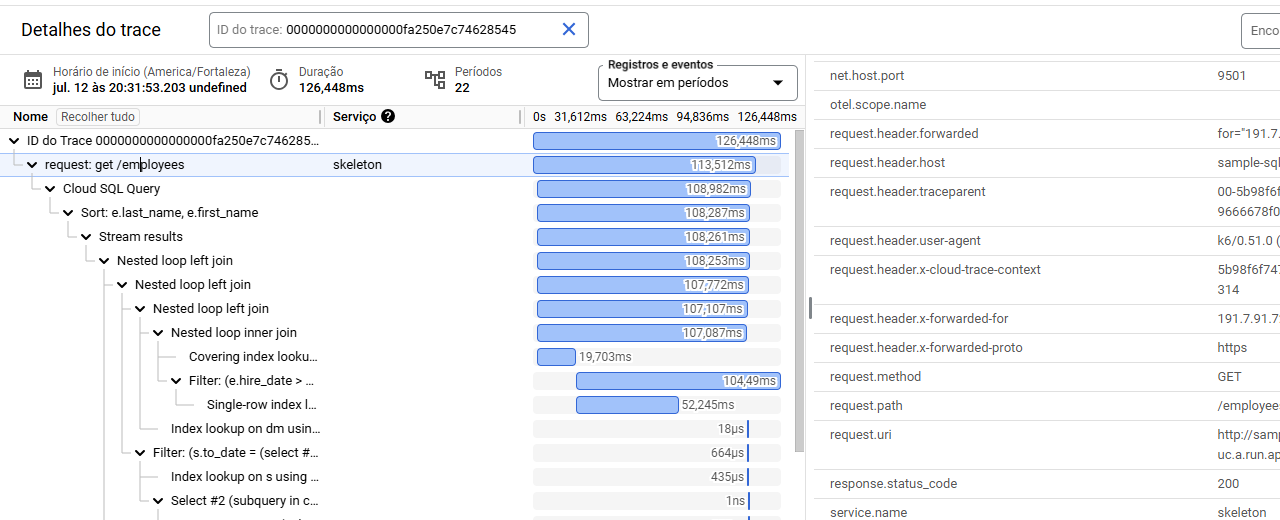
Below is a comparison between two images showing the trace information of the standard SQL in Hyperf and the trace from Cloud SQL Query:
The image below exemplifies the standard SQL trace in Hyperf:
The image below exemplifies the Cloud SQL trace associated with a request in Hyperf:
A tip when using the sqlcommenter-hyperf library is to disable the default SQL trace in Hyperf, as you will get more detailed information through the Cloud SQL Query trace in GCP.
Config
When you install the library in your project, it will be automatically enabled through the default settings. Therefore, to use this library, you only need to have it installed in your project.
However, if you want to disable some comments, you can do so through the settings. It is also worth mentioning that you can completely disable the execution of this library in a specific environment through the settings.
With the settings below, you can enable or disable the comments generated by this library. By default, all comments are
enabled. You will find this configuration in the config/autoload/sqlcommenter.php file:
'enable' => env('SQLCOMMENTER_ENABLE', true),
'include' => [
    'framework' => env('SQLCOMMENTER_ENABLE_FRAMEWORK', true),
    'controller' => env('SQLCOMMENTER_ENABLE_CONTROLLER', true),
    'action' => env('SQLCOMMENTER_ENABLE_ACTION', true),
    'route' => env('SQLCOMMENTER_ENABLE_ROUTE', true),
    'application' => env('SQLCOMMENTER_ENABLE_APPLICATION', true),
    'db_driver' => env('SQLCOMMENTER_ENABLE_DB_DRIVER', true),
],
See below for a detailed explanation of each of the settings:
| Setting | Type | Default | Description |
|---|---|---|---|
enable |
Boolean | true |
Controls whether SQLCommenter is enabled or disabled. Set to true to enable SQLCommenter and add comments to SQL queries. |
include.framework |
Boolean | true |
Includes the name of the framework used in the SQL comments. |
include.controller |
Boolean | true |
Includes the name of the controller responsible for the action that generated the SQL query. |
include.action |
Boolean | true |
Includes the name of the action or method within the controller that generated the SQL query. |
include.route |
Boolean | true |
Includes the route associated with the request that generated the SQL query. |
include.application |
Boolean | true |
Includes the name of the application in the SQL comments. |
include.db_driver |
Boolean | true |
Includes the name of the database driver used to execute the SQL query. |
Features
- Automatically adds sqlcommenter-compatible comments to SQL queries.
- Provides better traceability and insights into database interactions.
- Easy integration with the Hyperf framework.
- Supports multiple database drivers.
Performance
Using the Sqlcommenter Hyperf library may introduce a small performance impact due to the addition of comments to SQL queries. However, the benefits in terms of traceability, ease of debugging, and integration with monitoring tools generally outweigh this impact.
To demonstrate the effectiveness of the Sqlcommenter Hyperf library, we will conduct two distinct tests. The measurement will be performed in a controlled Google Cloud Run environment with the following configurations:
- CPU always allocated
- Minimum number of instances: 1
- Maximum number of instances: 1
- Memory per instance: 1GB
- Number of vCPUs per instance: 1vCPU
- Maximum concurrent requests per instance: 1000
See below the project that was used as experiment:
Average execution time test of the code block:
In this test, we will measure the average execution time of the SqlCommenterAspect code block that adds SQL comments. After collecting 10,000 execution time records for this operation, we calculated the average execution time, which was approximately 0.103 milliseconds (ms).
This value indicates that inserting SQL comments into queries is an extremely fast operation, adding negligible overhead to the total query execution time.
Request latency performance test
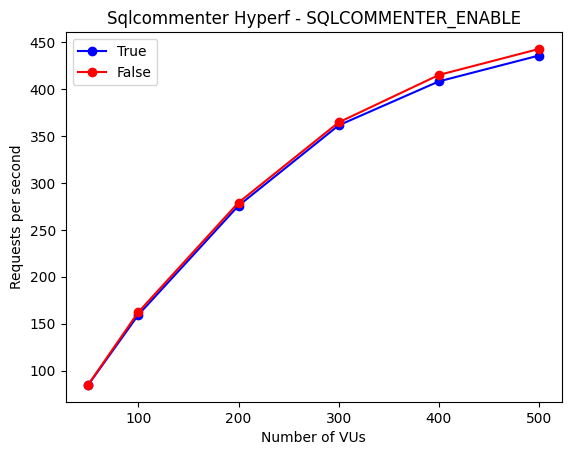
In this test, we will use K6 to make multiple requests and compare the performance with the library enabled and disabled. See the results of this experiment below:
When analyzing the above image, we can see that initially, the response times are very similar for both configurations. However, as CPU consumption increases and we approach the limit of 1 vCPU, the disabled configuration (False) starts to perform slightly better. By examining the CPU utilization graphs, we observed that at around 400 VUs, CPU usage was approximately 98% for both configurations.
When the library is not competing intensely for CPU usage, it manages to maintain very good performance, close to that of the disabled configuration. This suggests that under high-demand conditions, the disabled configuration can handle the load slightly better, resulting in a marginal increase in the number of requests served per second.
If you want to check the detailed information about the test, it is recommended to click the link below:
Changelog
Please see CHANGELOG for more information about what has changed recently.
Contributing
Do you want to be part of this project? Read how to contribute.
Security Vulnerabilities
Please review our security policy on how to report security vulnerabilities.
License
This project is under license. See the LICENSE file for more details.

