
privatus / filament-analytics

Privatus Analytics dashboard widgets for Filament: visitors, pageviews, a traffic chart, top pages and top sources from cookieless website analytics.
Package info
github.com/Privatus-Analytics/filament-analytics
pkg:composer/privatus/filament-analytics
Requires
- php: ^8.2
- filament/filament: ^4.0 || ^5.0
- privatus/analytics: ^1.0
Requires (Dev)
- friendsofphp/php-cs-fixer: ^3.64
- orchestra/testbench: ^9.0 || ^10.0 || ^11.0
- phpstan/phpstan: ^2.0
- phpunit/phpunit: ^11.0 || ^12.0
Suggests
None
Provides
None
Conflicts
None
Replaces
None
README

See your website traffic on your Filament dashboard, without a cookie pop-up and without bots in your numbers.
Most analytics tools set cookies, so you need a pop-up that asks for consent. Many visitors say no or leave, and your numbers end up wrong. Bots make it worse by adding visits that never happened.
Privatus Analytics counts visits without cookies and without storing anything that points to one person. It filters out bots. This plugin shows those numbers right inside your Filament panel, so you and your team never have to open another tool to see how the site is doing.
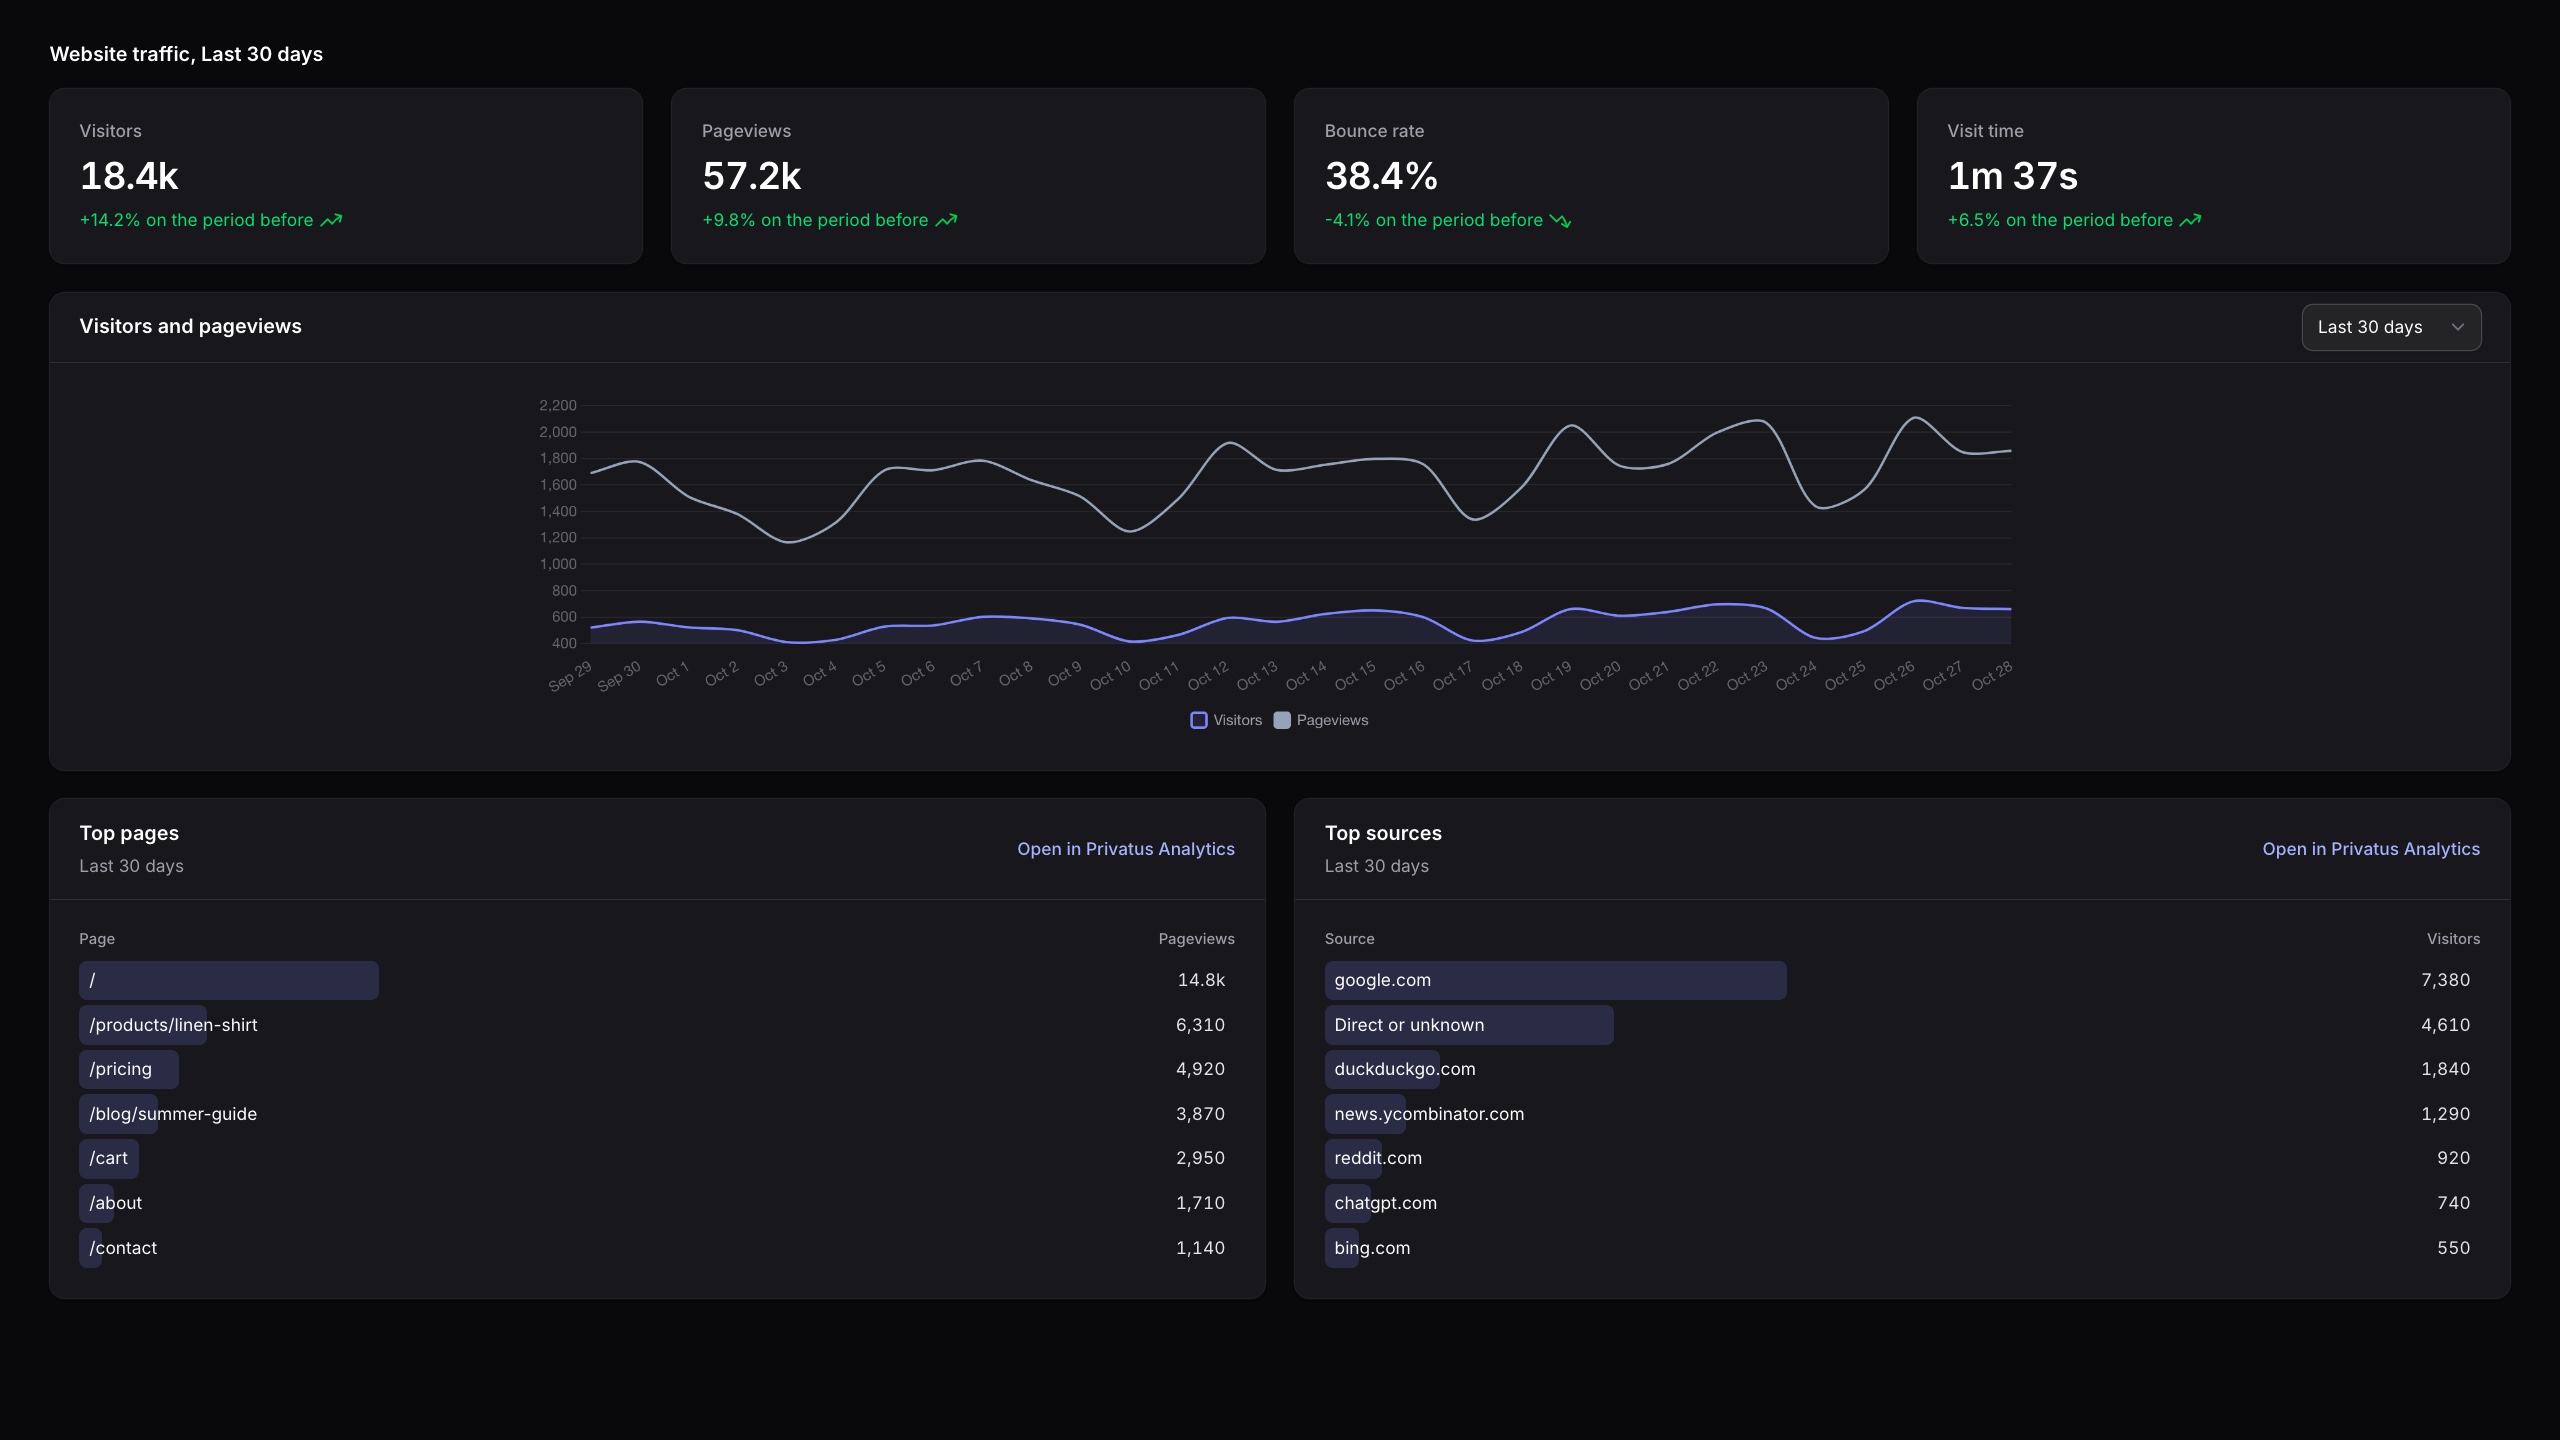
What you get
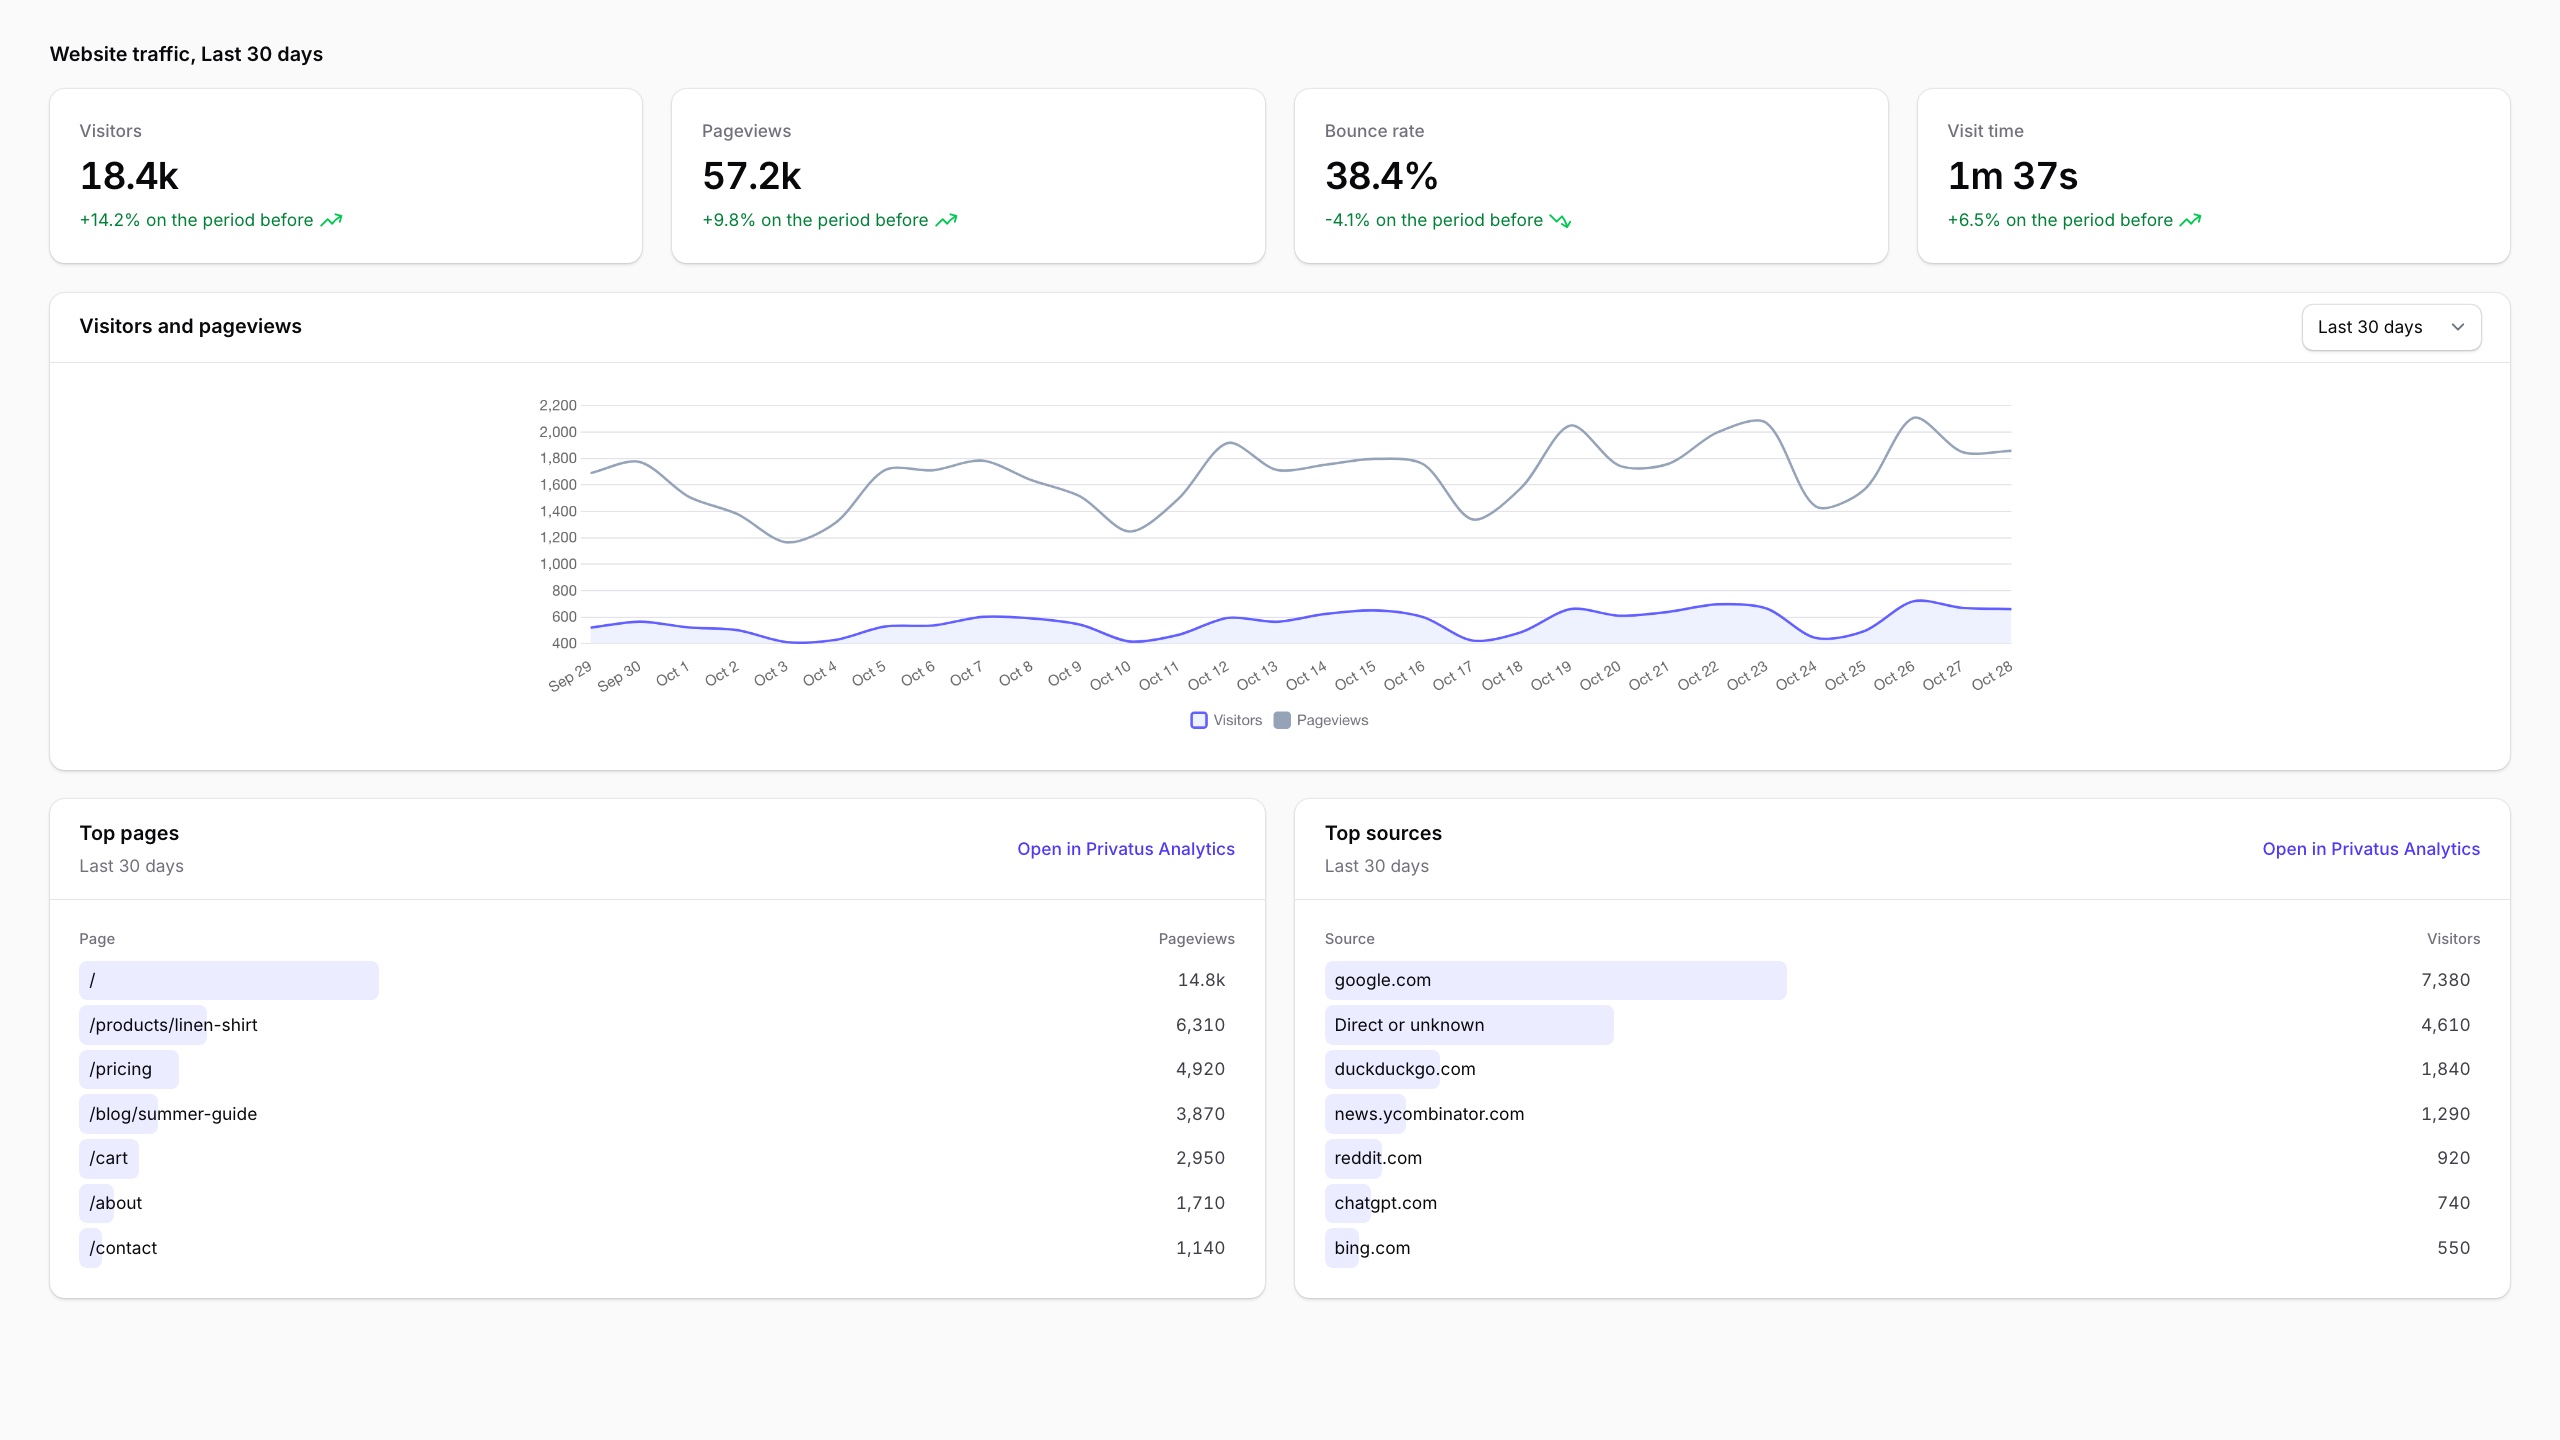
- Traffic at a glance. Visitors, pageviews, bounce rate and visit time, each with the change against the period before.
- A traffic chart. Visitors and pageviews over time, with a picker for today, the last 7 days, this month, the last 12 months and more.
- Top pages. The pages people look at the most.
- Top sources. The sites, searches and AI tools that send you visitors.
- Count your panel too (optional). One line adds the tracker to the panel itself.
- Works in light and dark mode. Every text can be translated.
The widgets only read numbers from the Privatus Analytics API. Results are cached for 5 minutes, so the dashboard stays fast.
Requirements
- PHP 8.2 or later
- Filament 4 or 5
- A Privatus Analytics account. The free plan has 10,000 events a month and 3 sites, and needs no card. Start free.
Install
composer require privatus/filament-analytics
Add the plugin to your panel, usually in app/Providers/Filament/AdminPanelProvider.php:
use Privatus\FilamentAnalytics\PrivatusAnalyticsPlugin;

public function panel(Panel $panel): Panel
{
    return $panel
        // ...
        ->plugin(PrivatusAnalyticsPlugin::make());
}
Add two lines to your .env file:
PRIVATUS_SITE_ID=pa_YOURSITEID
PRIVATUS_API_TOKEN=pat_yourtoken
- Site ID: in Privatus Analytics, open your site, then Site settings, Tracking. It starts with
pa_. - API token: open Workspace settings, then API tokens, and make a new token. It starts with
pat_. Keep it in.envand never commit it.
Open your dashboard. The four widgets are there.
Add the tracker to your website
The widgets show what the tracker counts. If your Laravel site does not have the tracker yet, add this tag inside <head> on every page:
<script defer src="https://privatusstats.com/js/pa.js" data-site="pa_YOURSITEID" data-modules="engage,auto,vitals,clicks,ask"></script>
This plugin installs privatus/analytics too, so in Blade you can also write @privatusAnalytics in your layout. Custom events come from the browser with window.privatus.track('Signup', { plan: 'pro' }). See the tracker docs.
Options
PrivatusAnalyticsPlugin::make()
    // Count visits to this Filament panel too. Uses PRIVATUS_SITE_ID unless you pass another site.
    ->trackPanel(siteId: 'pa_PANELSITEID')
    // Tracker modules for trackPanel(). The default is all five.
    ->modules(['engage', 'auto', 'vitals', 'clicks', 'ask'])
    // Do not add the widgets to the dashboard, for example to place them yourself.
    ->widgets(false);
Place a widget yourself on any page or dashboard:
use Privatus\FilamentAnalytics\Widgets\TopPages;
use Privatus\FilamentAnalytics\Widgets\TopSources;
use Privatus\FilamentAnalytics\Widgets\VisitorsChart;
use Privatus\FilamentAnalytics\Widgets\VisitorsOverview;

protected function getHeaderWidgets(): array
{
    return [VisitorsOverview::class, VisitorsChart::class];
}
Publish the config file to change the first date range, the cache time or the number of rows:
php artisan vendor:publish --tag=privatus-filament-config
| Setting | .env key |
Default |
|---|---|---|
site_id |
PRIVATUS_SITE_ID |
none |
api_token |
PRIVATUS_API_TOKEN |
none |
period |
PRIVATUS_FILAMENT_PERIOD |
30d |
cache_seconds |
300 |
|
rows |
7 |
To change the words, publish the translations with php artisan vendor:publish --tag=privatus-filament-translations.
When something is wrong
The widgets never break your dashboard. If the site ID or token is missing, wrong, or the API cannot be reached, they show a short note that says what to fix.
Privacy
The plugin sends your API token and site ID to privatusanalytics.com to read your stats. It sends nothing about the people using your panel. If you turn on trackPanel(), the Privatus Analytics tracker counts panel visits the same cookieless way it counts your website.
Testing
composer test
./run-docker.sh                     # tests, code style and static checks in Docker
PHP=8.2 FILAMENT=4 ./run-docker.sh  # the same on Filament 4
Links
License
MIT. See LICENSE. Made by Two Phase LLC, the company behind Privatus Analytics.