leventcz / laravel-top
Real-time monitoring straight from the command line for Laravel applications.
Requires
- php: ^8.2.0
- ext-pcntl: *
- laravel/framework: ^10.0|^11.0|^12.0|^13.0
- react/event-loop: ^1.5
Requires (Dev)
- laravel/pint: ^1.15
- mockery/mockery: ^1.6
- pestphp/pest: ^2.34|^3.7|^4.4
- phpstan/phpstan: ^1.10|^2.1
README
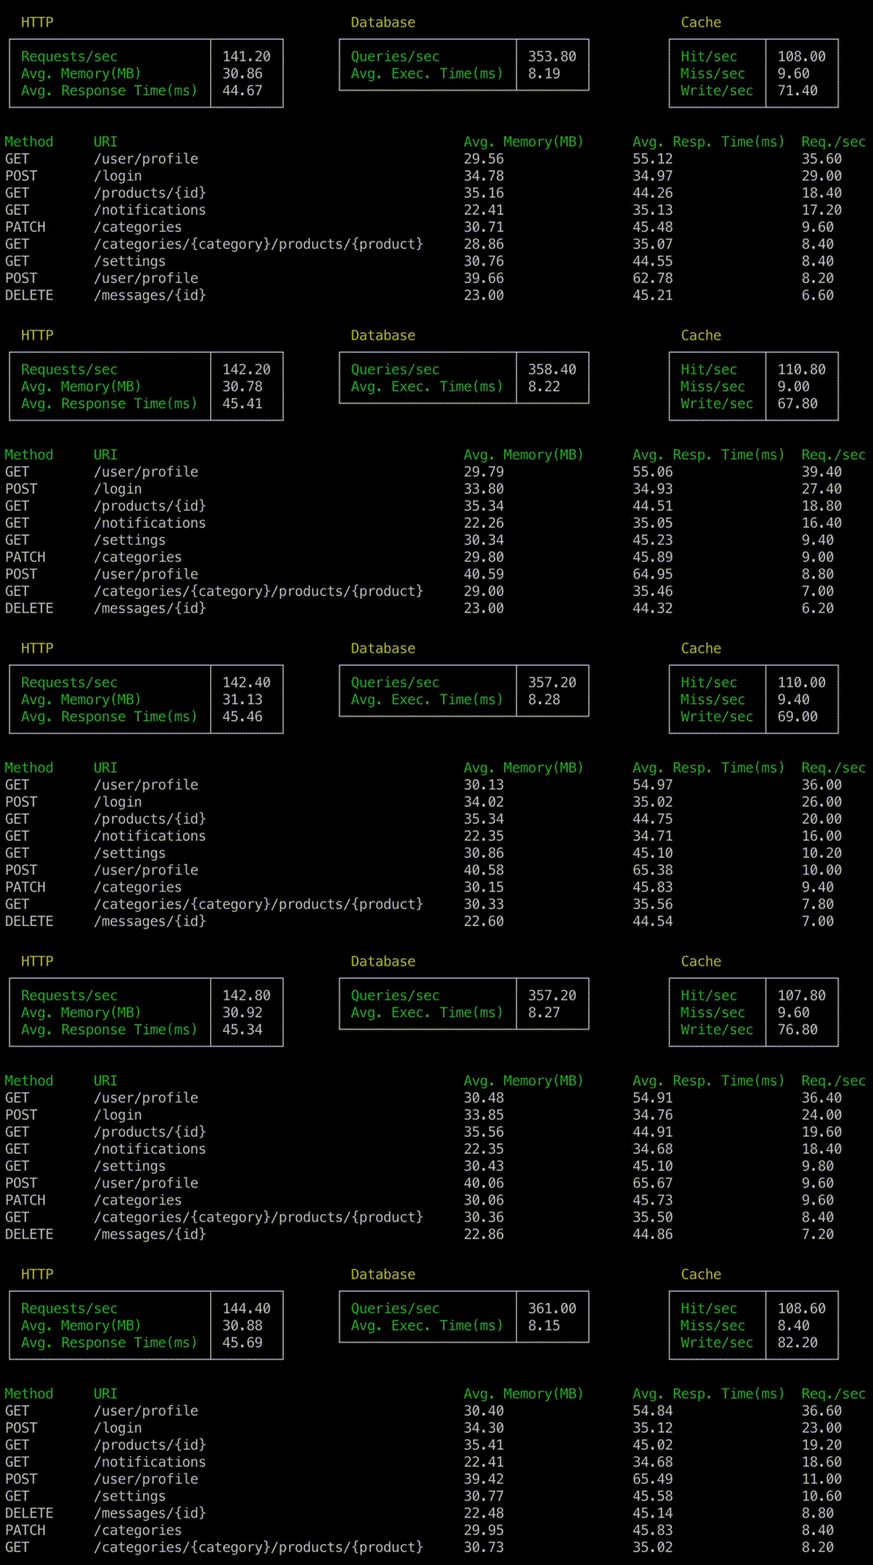
php artisan top
Top provides a lightweight solution for real-time monitoring directly from the command line for Laravel applications. It is designed for production environments, enabling you to effortlessly track essential metrics and identify the busiest routes.
How it works
Top listens to Laravel events and saves aggregated data to Redis behind the scenes to calculate metrics. The aggregated data is stored with a short TTL, ensuring that historical data is not retained and preventing Redis from becoming overloaded. During display, metrics are calculated based on the average of the last 5 seconds of data.
Top only listens to events from incoming requests, so metrics from operations performed via queues or commands are not reflected.
Since the data is stored in Redis, the output of the top command reflects data from all application servers, not just the server where you run the command.
Installation
Compatible with Laravel 10+ and Laravel Octane.
Requires PHP 8.2+ | Redis 5.0+
composer require leventcz/laravel-top
Configuration
You can publish the config file with:
php artisan vendor:publish --tag="top"
<?php

return [

    /*
    |--------------------------------------------------------------------------
    | Redis Connection
    |--------------------------------------------------------------------------
    |
    | Specify the Redis database connection from config/database.php
    | that Top will use to save data.
    | The default value is suitable for most applications.
    |
    */

    'connection' => env('TOP_REDIS_CONNECTION', 'default'),

    /*
    |--------------------------------------------------------------------------
    | Recording Mode
    |--------------------------------------------------------------------------
    |
    | Determine when Top should record application metrics based on this value.
    | By default, Top only listens to your application when it is running.
    | If you want to access metrics through the facade, you can select the "always" mode.
    |
    | Available Modes: "runtime", "always"
    |
    */

    'recording_mode' => env('TOP_RECORDING_MODE', 'runtime'),
];
Facade
If you want to access metrics in your application, you can use the Top facade.
<?php

use Leventcz\Top\Facades\Top;
use Leventcz\Top\Data\Route;

// Retrieve HTTP request metrics
$requestSummary = Top::http();
$requestSummary->averageRequestPerSecond;
$requestSummary->averageMemoryUsage;
$requestSummary->averageDuration;

// Retrieve database query metrics
$databaseSummary = Top::database();
$databaseSummary->averageQueryPerSecond;
$databaseSummary->averageQueryDuration;

// Retrieve cache operation metrics
$cacheSummary = Top::cache();
$cacheSummary->averageHitPerSecond;
$cacheSummary->averageMissPerSecond;
$cacheSummary->averageWritePerSecond;

// Retrieve the top 20 busiest routes
$topRoutes = Top::routes();
$topRoutes->each(function(Route $route) {
    $route->uri;
    $route->method;
    $route->averageRequestPerSecond;
    $route->averageMemoryUsage;
    $route->averageDuration;
});

// Force Top to start recording for the given duration (in seconds)
Top::startRecording(int $duration = 5);

// Force Top to stop recording
Top::stopRecording();

// Check if Top is currently recording
Top::isRecording();
Testing
composer test
License
The MIT License (MIT). Please see License File for more information.

