kanti / server-timing
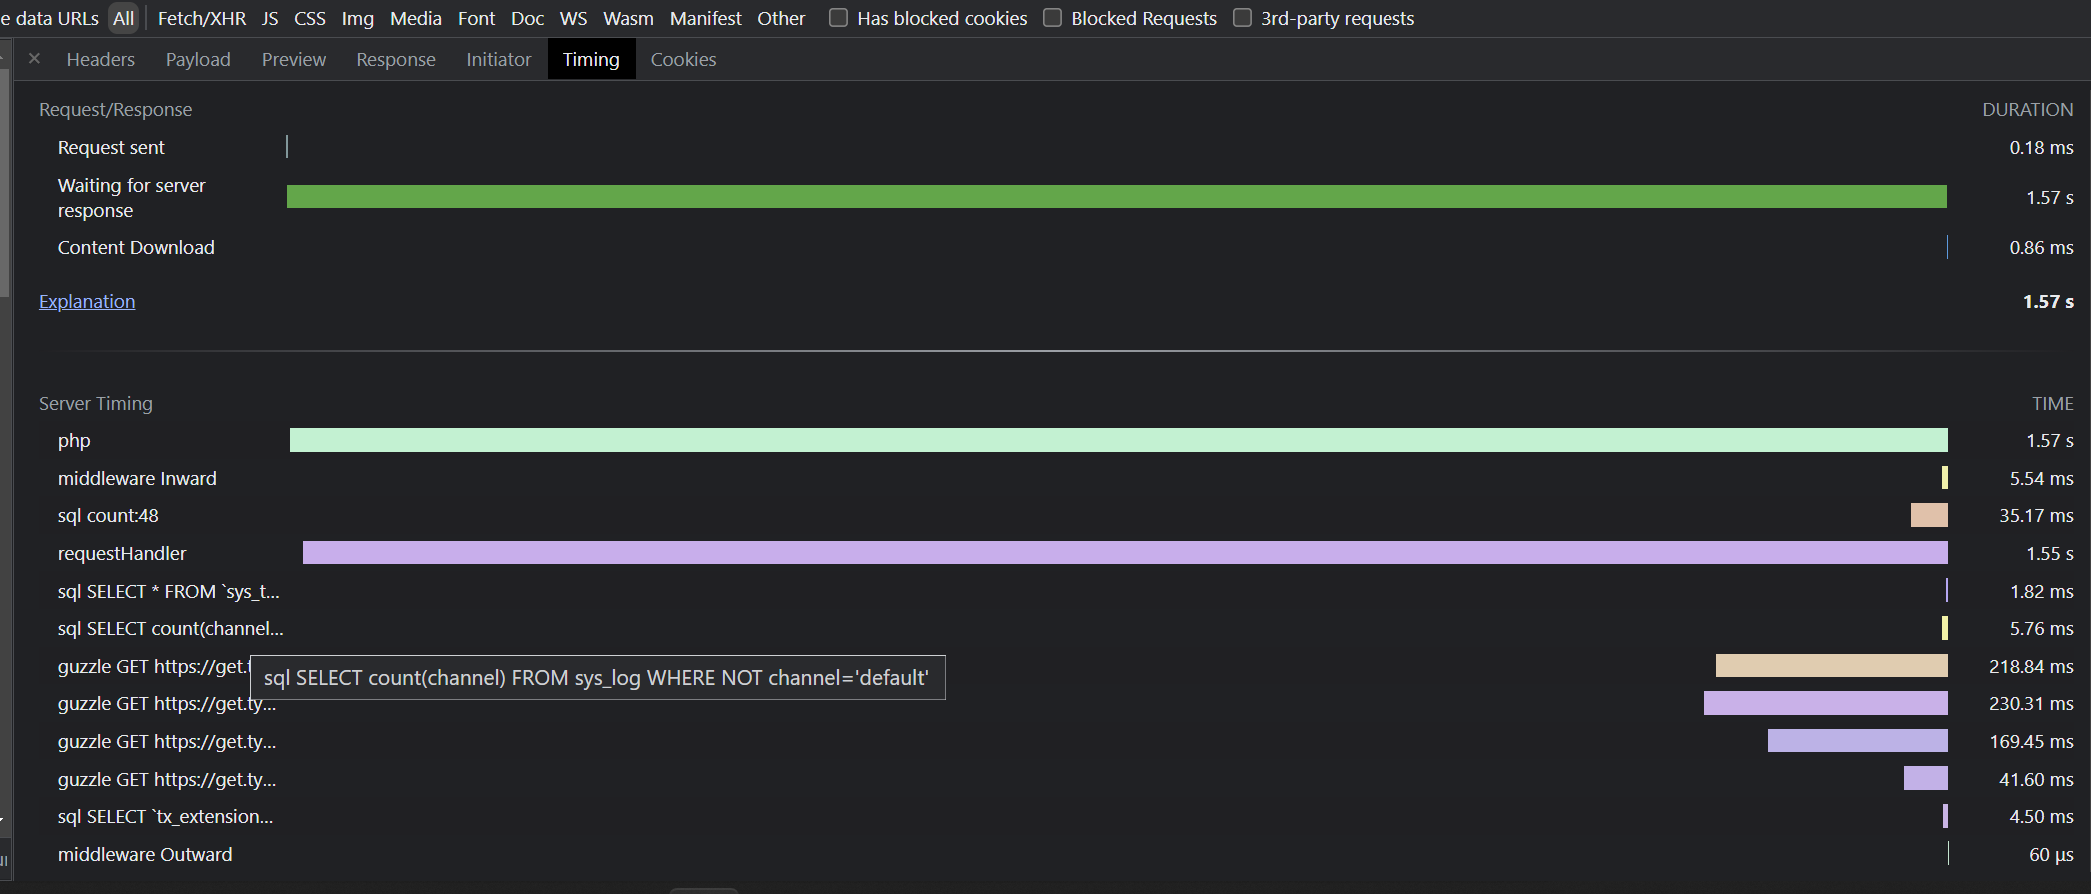
Show timings of Database and HTTP Calls (send them to Sentry)
Package info
github.com/Kanti/server-timing
Type:typo3-cms-extension
pkg:composer/kanti/server-timing
Requires
- php: ~8.2.0 || ~8.3.0 || ~8.4.0
- composer-runtime-api: ^2.0.0
- typo3/cms-core: ^13.0 || ^14.0
- typo3/cms-extbase: ^13.0 || ^14.0
Requires (Dev)
- infection/infection: ^0.26.13 || ^0.27.11 || ^0.29.14
- phpstan/extension-installer: ^1.1
- phpunit/phpunit: ^10 || ^11
- pluswerk/grumphp-config: ^7 || ^10 || ^11
- saschaegerer/phpstan-typo3: ^2.1.0 || ^3.0.1
- sentry/sdk: ^3.5
- ssch/typo3-rector: ^2.6.4 || ^3.3.0
- typo3/cms-adminpanel: ^13.0 || ^14.0
This package is auto-updated.
Last update: 2026-04-28 07:42:17 UTC
README
installation
composer require kanti/server-timing
at the moment there is nothing to configure
Server timings are not displayed in production for users who are not logged into the backend.
Included measurements:
php: from start of php call to the register shutdown functionconsole.command: from start of the console command callmiddleware.in: will show how much time was spend in a middleware to prepare the Requestmiddleware.out: will show how much time was spend in a middleware to change the Responsedb: shows the sql query'smail: shows the mails that are send (only TYPO3 >=12)dataP: Shows the DataProcessors that were executedextbase: show all Extbase dispatches, (forwards are included in the original action call)fileProcessing: show all file processing callshttp.client: external API calls are measured if they use the official TYPO3RequestFactoryor theGuzzleClientFactory)
if a measurement key has more than 4 entries, they will get combined into one total time with a count. And the 3 longest entries will be kept
Sentry Tracing
if you have sentry enabled (different Extension eg. pluswerk/sentry or networkteam/sentry-client) than you can activate the tracing.
sentry_sample_rate- if empty
- if set to a number like
0.1it will track 10% of all Requests in sentry.
- if empty
sentry_cli_sample_rate- just like
sentry_sample_ratebut this setting is for the cli calls of thetypo3binary
- just like
stop_watch_limitis set for long-running processes, if you get memory problems you can lower this setting. (default: 100_000)- you can force the Tracing of Requests by adding the Cookie
XDEBUG_TRACEwith any value.

Measure your own timings:
stopWatch function (recommended)
  $stop = \Kanti\ServerTiming\Utility\TimingUtility::stopWatch('doSomething', 'additional Information');
  $result = $this->doSomethingExpensive();
  $stop();
start & stop functions
this has some limitations, there can only be one
doSomethingat a time.
  \Kanti\ServerTiming\Utility\TimingUtility::start('doSomething', 'additional Information');
  $result = $this->doSomethingExpensive();
  \Kanti\ServerTiming\Utility\TimingUtility::end('doSomething');
TODO List:
todos:
- more tests
composer patches needed?
- fluid renderings (possible solution with XClasses?)
wanted:
- functional tests
nice to have?
- ViewHelpers

