daseraf / magento2-debug
Magento 2 debug module based on Magento 1 Profiler with some extra features.
Maintainers
Package info
github.com/Daseraf/magento2-debug
Type:magento2-module
pkg:composer/daseraf/magento2-debug
Requires
- daseraf/magento2-debug-theme: ^1.0
- filp/whoops: ^2.1
- jdorn/sql-formatter: ^1.2
- magento/framework: ~101.0|~102.0|~103.0
- magento/module-backend: ~100.2|~101.0|~102.0
- magento/module-developer: ^100.2
- symfony/stopwatch: ^2.8 || ^3.0 || ^4.0 || ^5.0 || ^6.0
- symfony/var-dumper: *
Requires (Dev)
- php-coveralls/php-coveralls: ^2.1
- phpmd/phpmd: ^2.6
- sebastian/phpcpd: ^3.0
- squizlabs/php_codesniffer: ^3.3
This package is auto-updated.
Last update: 2026-07-15 09:49:47 UTC
README
Module for debugging Magento 2 performance. It works without overwriting any core files and it can be installed with composer.

The module supports Hyva Theme!

Important - the module is not intended to work in a production environment!
Installation
- Enable developer mode
php bin/magento deploy:mode:set developer - Install module via composer
composer require daseraf/magento2-debug - Register module
php bin/magento setup:upgrade - Enable profiler in configuration:
Stores -> Configuration -> Advanced -> Debug - Clear cache
php bin/magento c:c
Important! If you use the interceptor generator from Creatuity, you need to additionally install this package - daseraf/magento2-debug-creatuity.
If you want to see Callmap
For this functionality you will need to install the xhprof extension for your PHP interpreter. I recommend using PECL for these purposes. https://pecl.php.net/package/xhprof
Enable Callmap collector
pecl install xhprof
Xhprof extension configuration
Just enable extension:
extension=xhprof.so
Xhprof flags are set from the Magento admin panel
Advanced -> Debug -> Data collectors -> Xhprof Flags
If you want to monitor queries to the database, run this command
php bin/magento debug:db-profiler:enable
This will add a profiler flag to the database section of the env.php file
To disable use the following command:
php bin/magento debug:db-profiler:disable
Compatibility
- Magento 2.2 - 2.4
- PHP 7.0 - 8.1
Profiler collectors
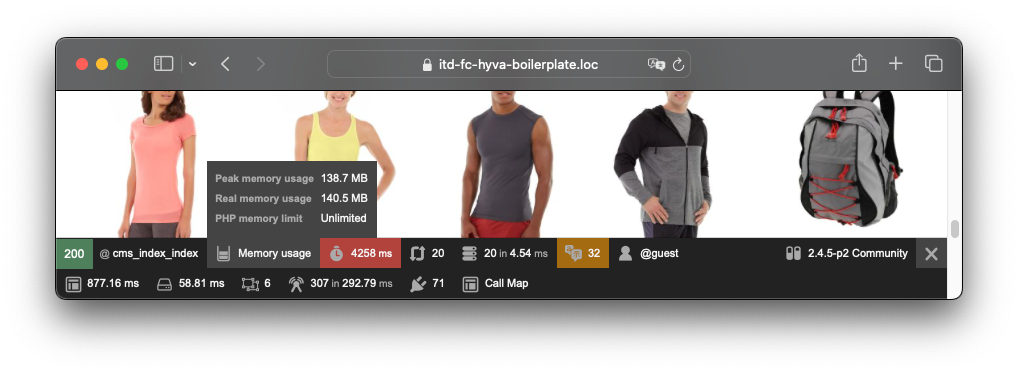
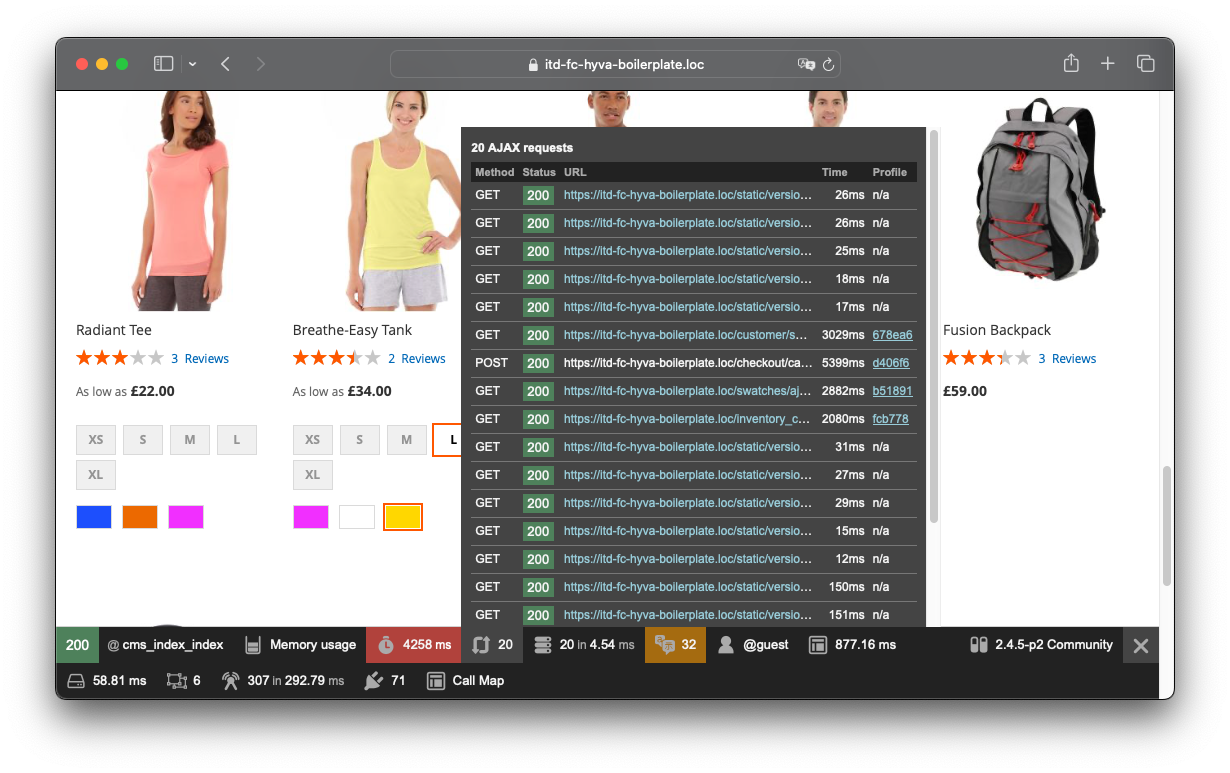
- Ajax - Please note that you can profile any requests coming into the platform, such as adding to cart
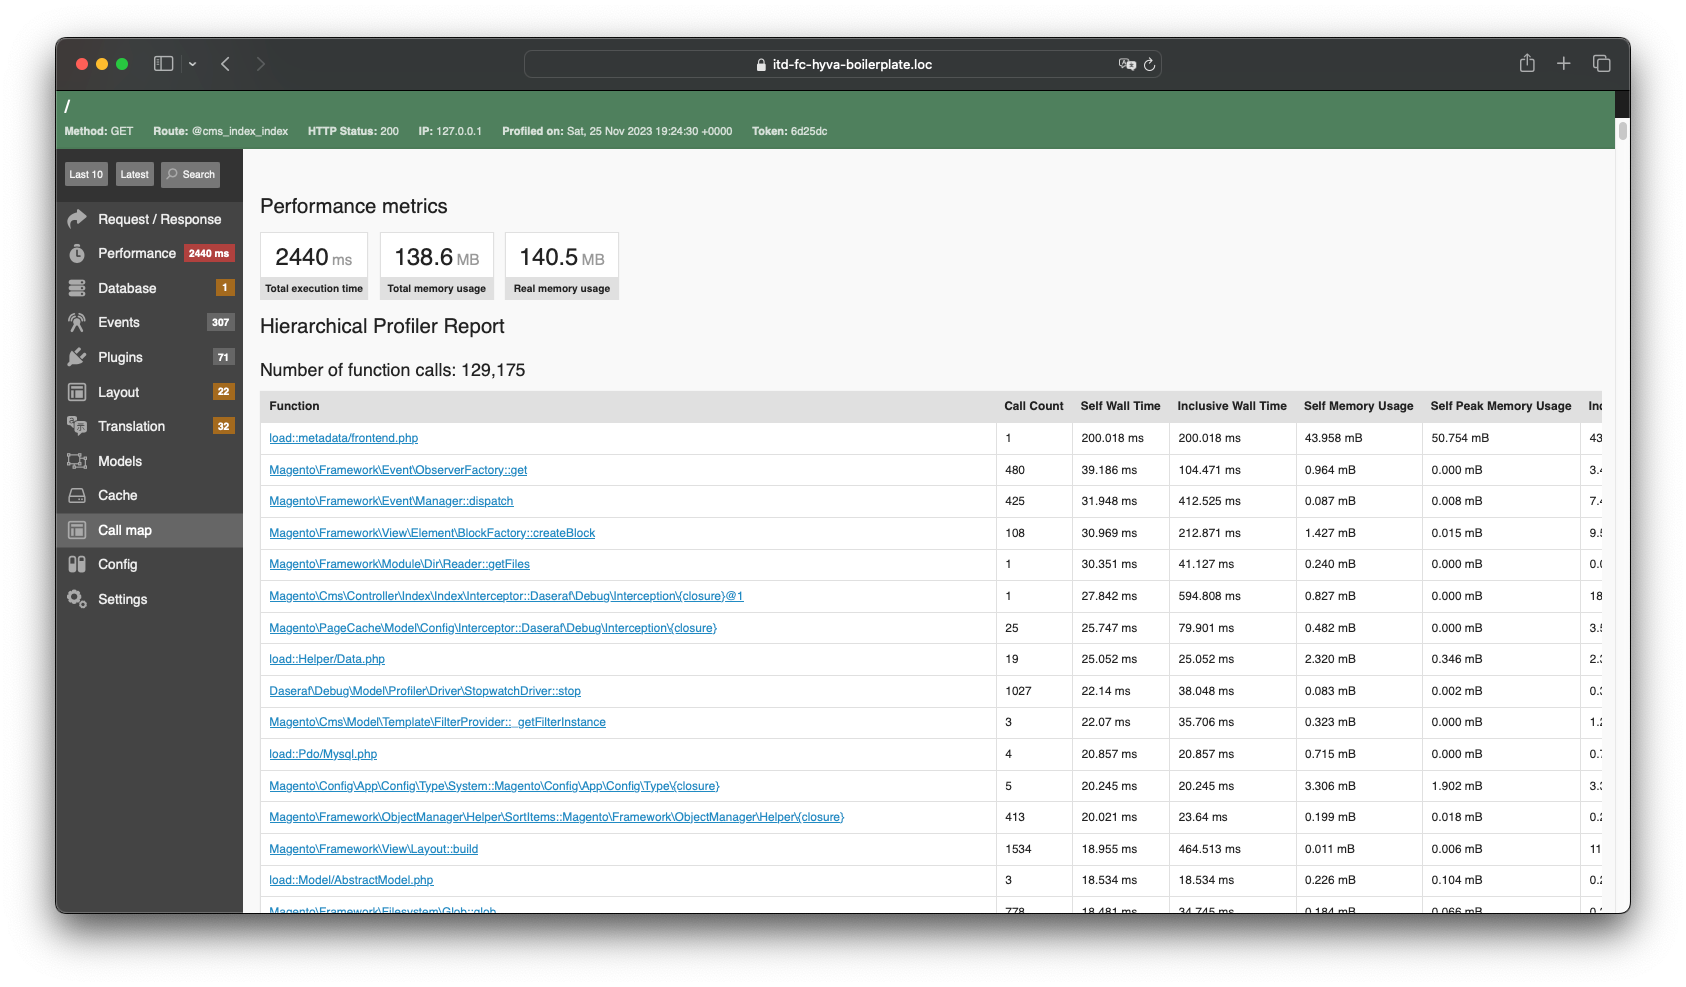
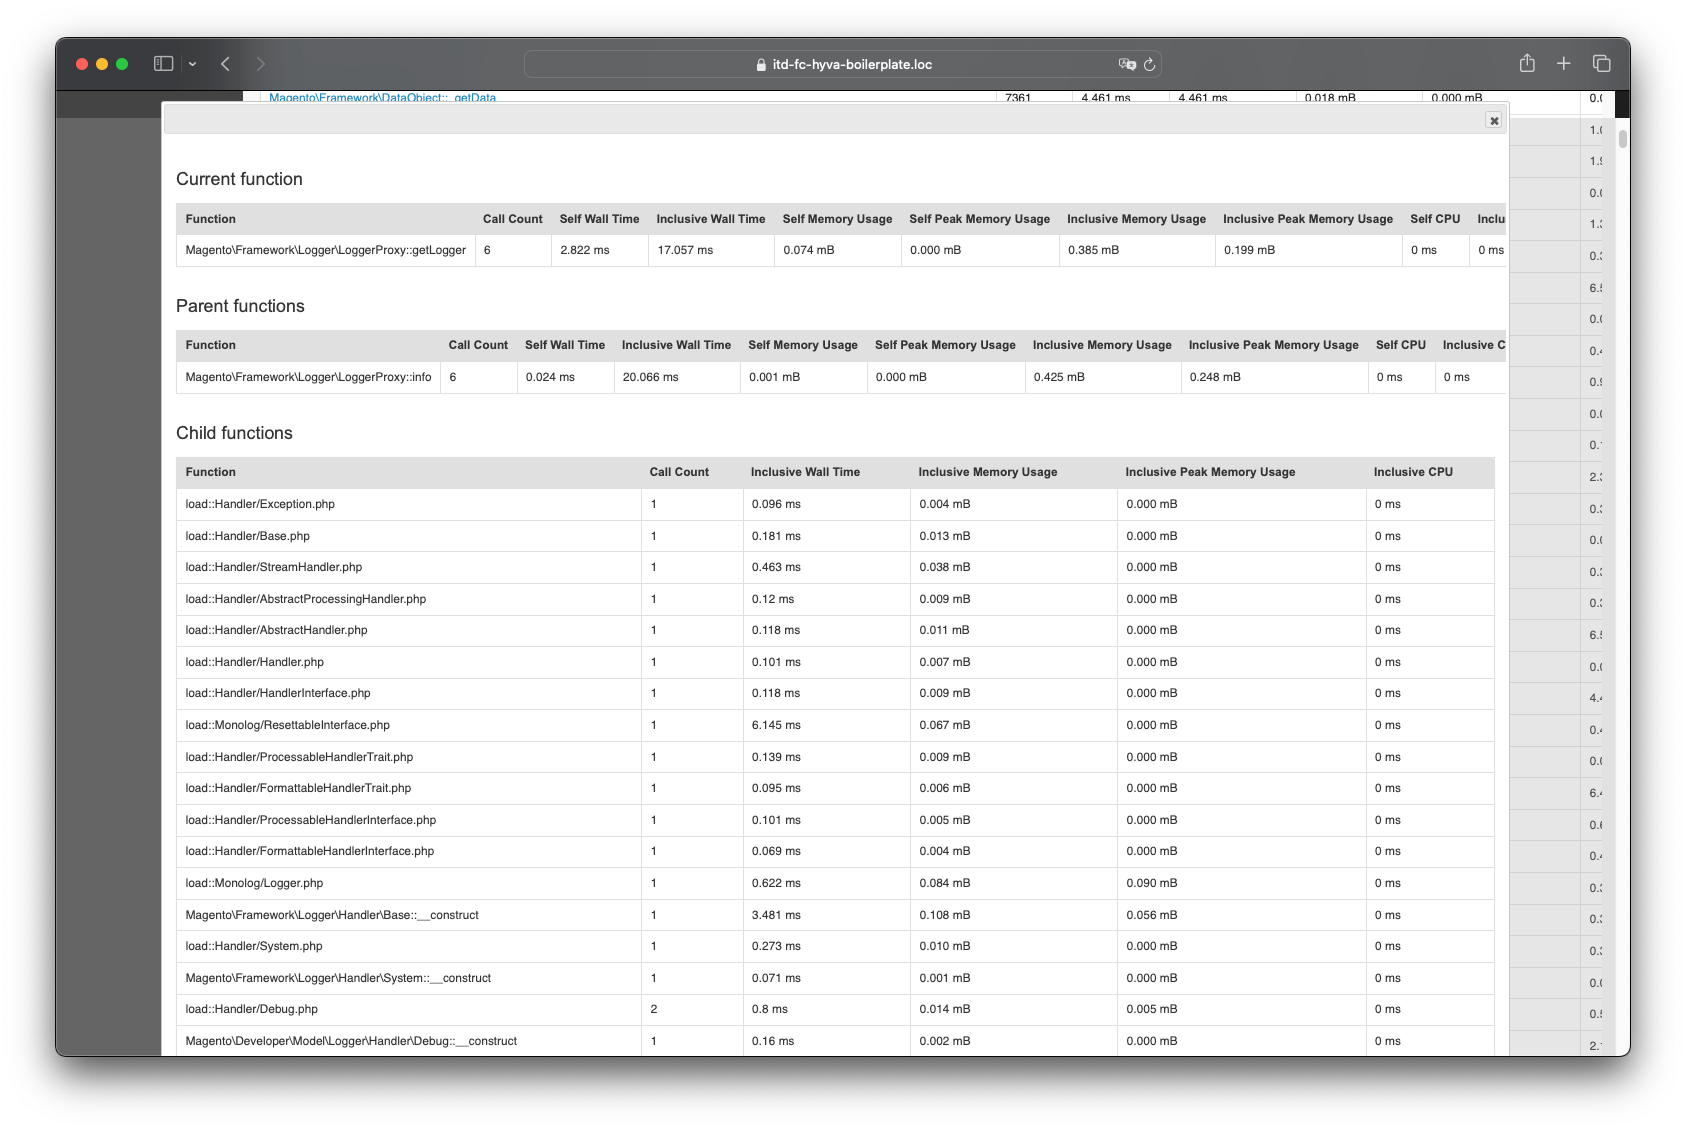
- Call map - Shows the time spent performing each function. XHprof extension required
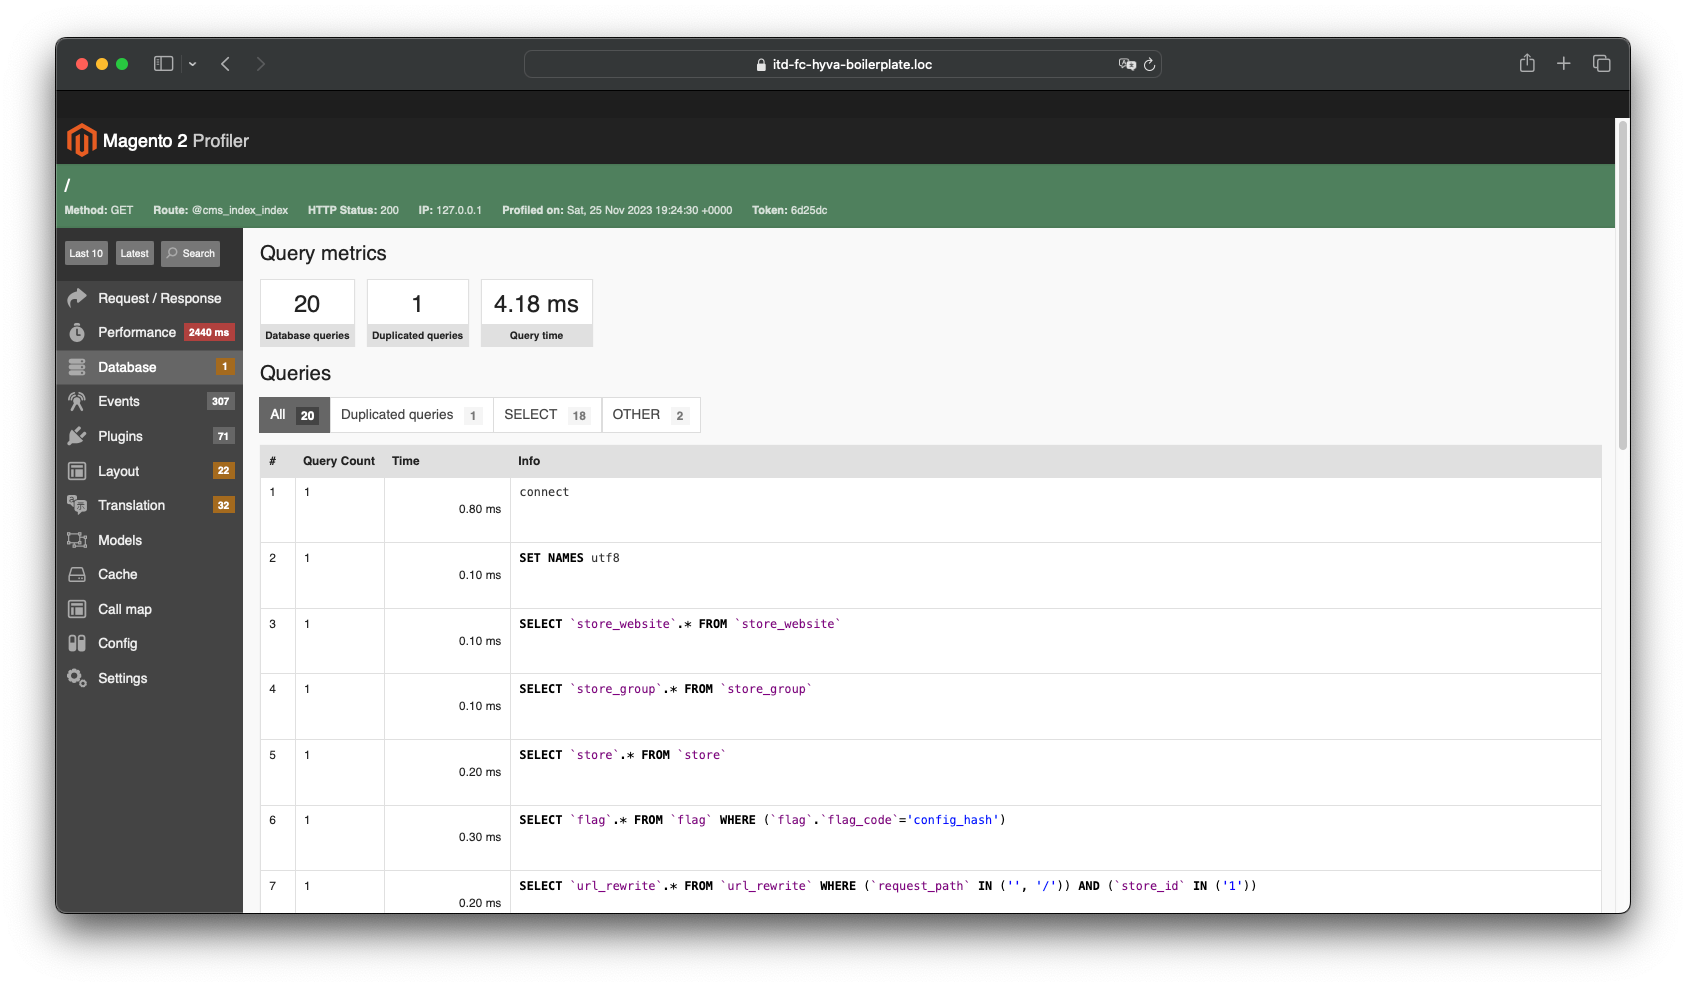
- Database - Database queries and variable values
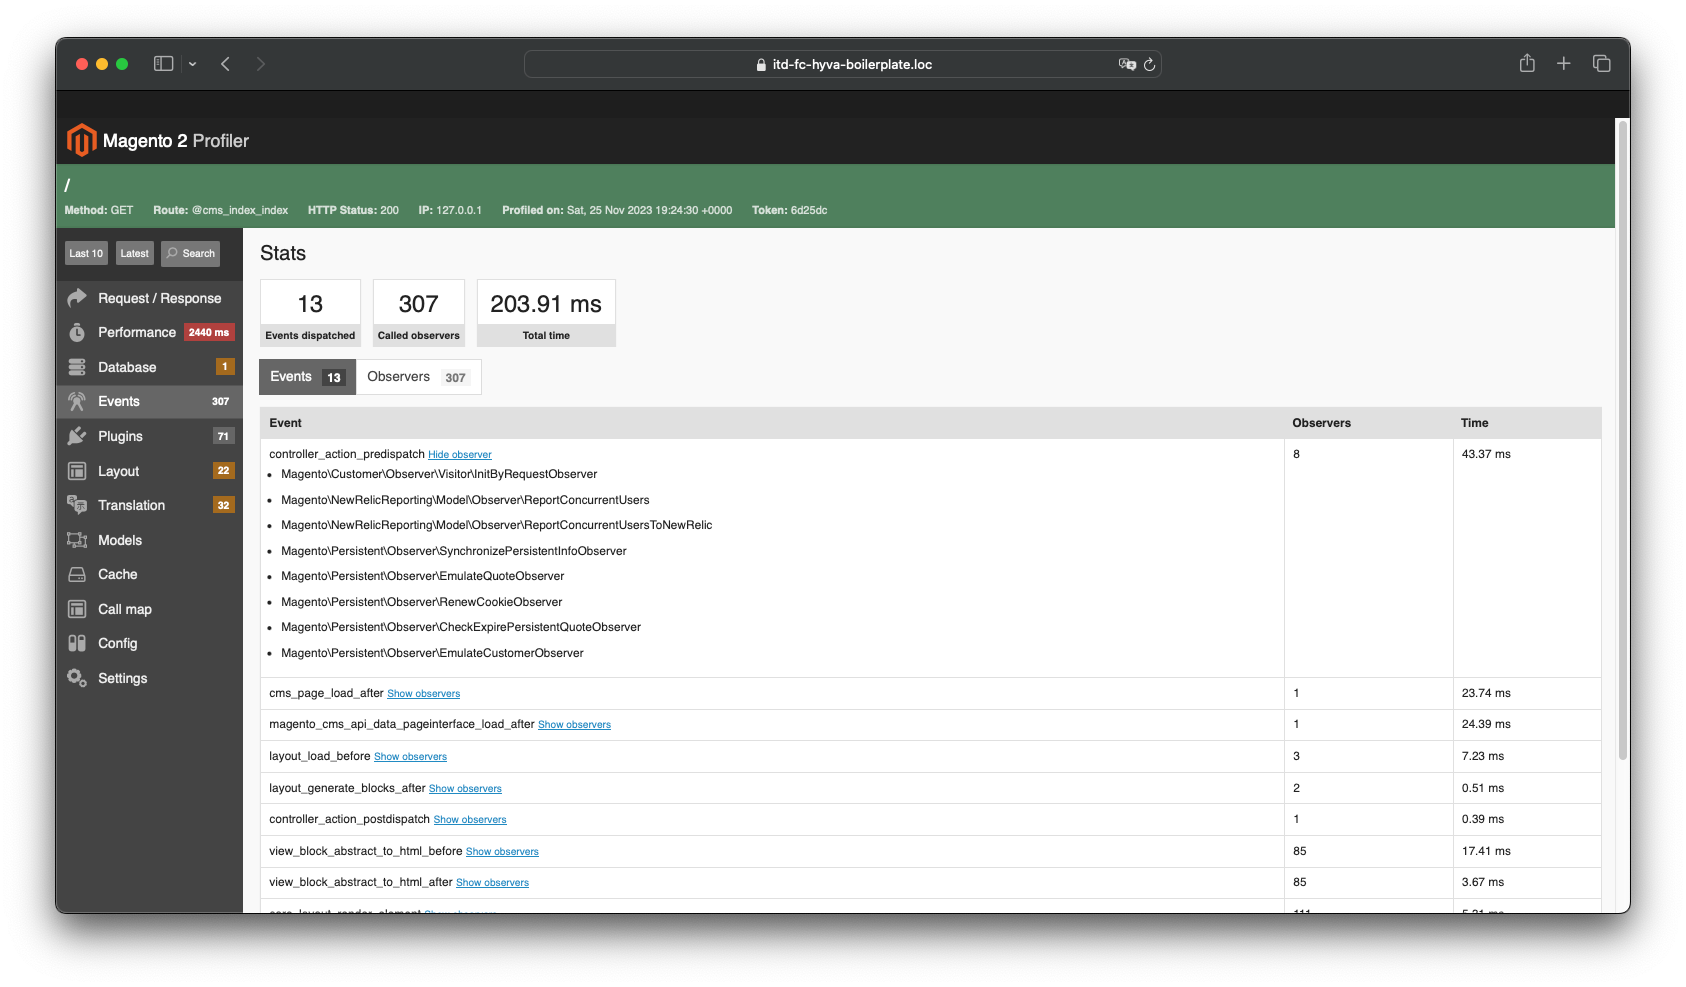
- Events - Displays all sent events as well as the observers tracking them
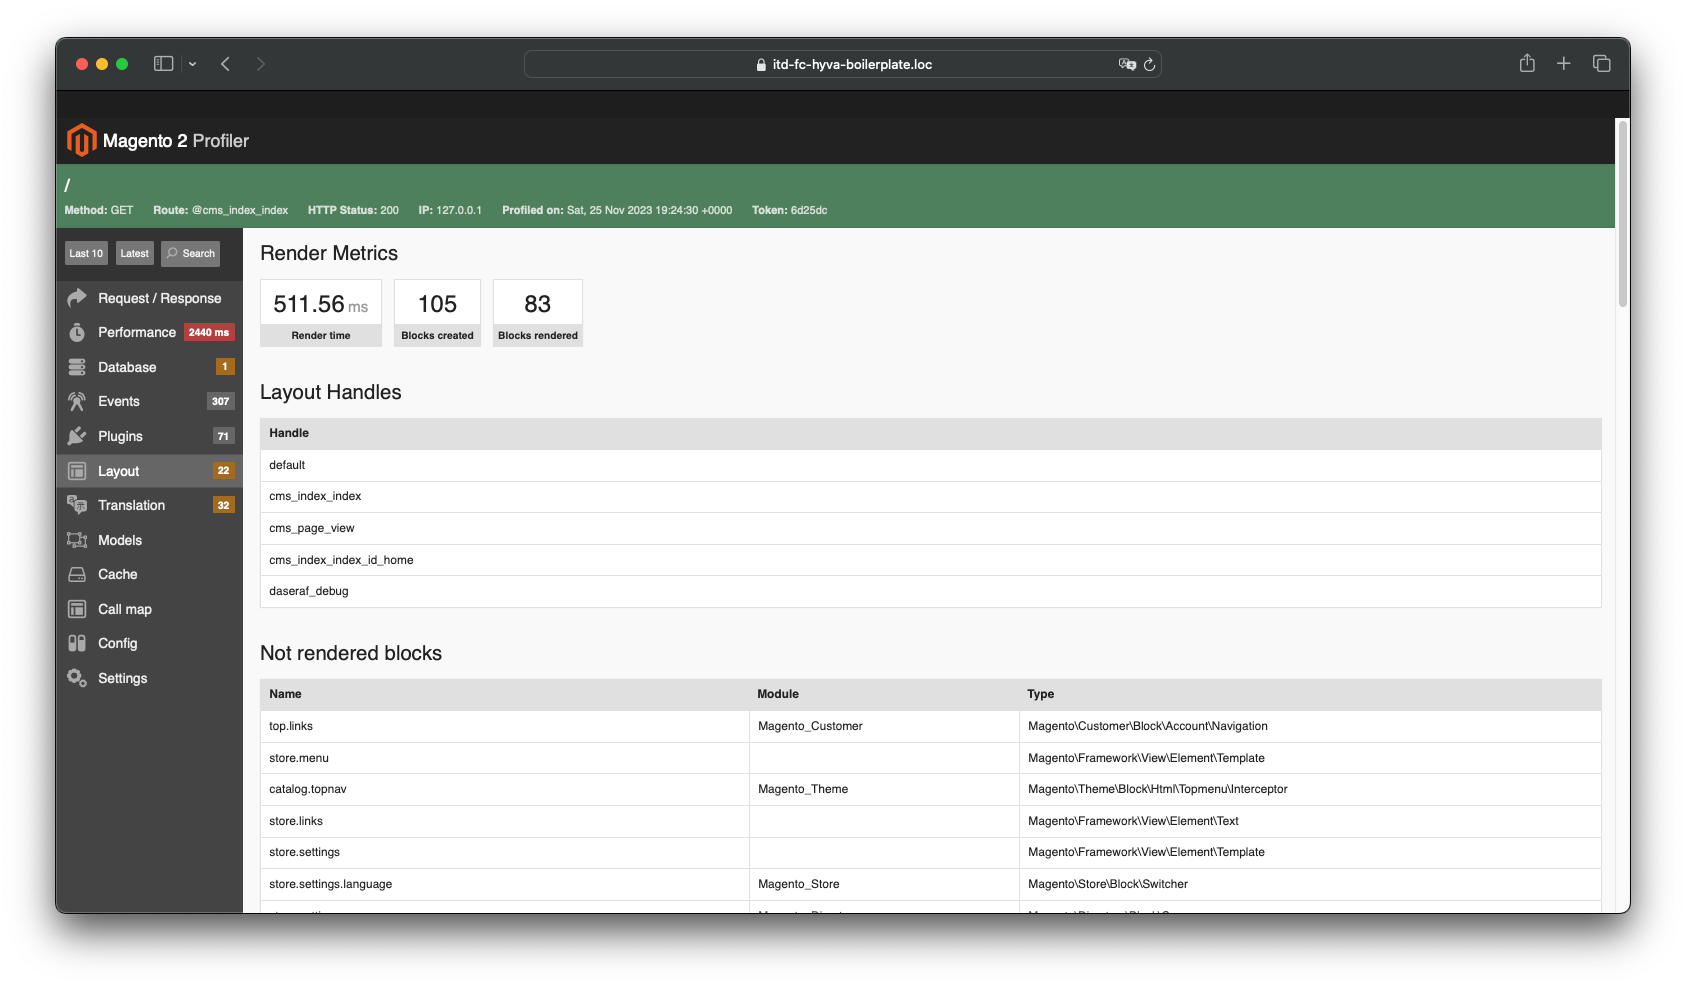
- Layout - Displays a list of blocks and the time spent on rendering them
- Layout Rendering analysis (Layout tab) - Detailed information on each block and caching status for them.
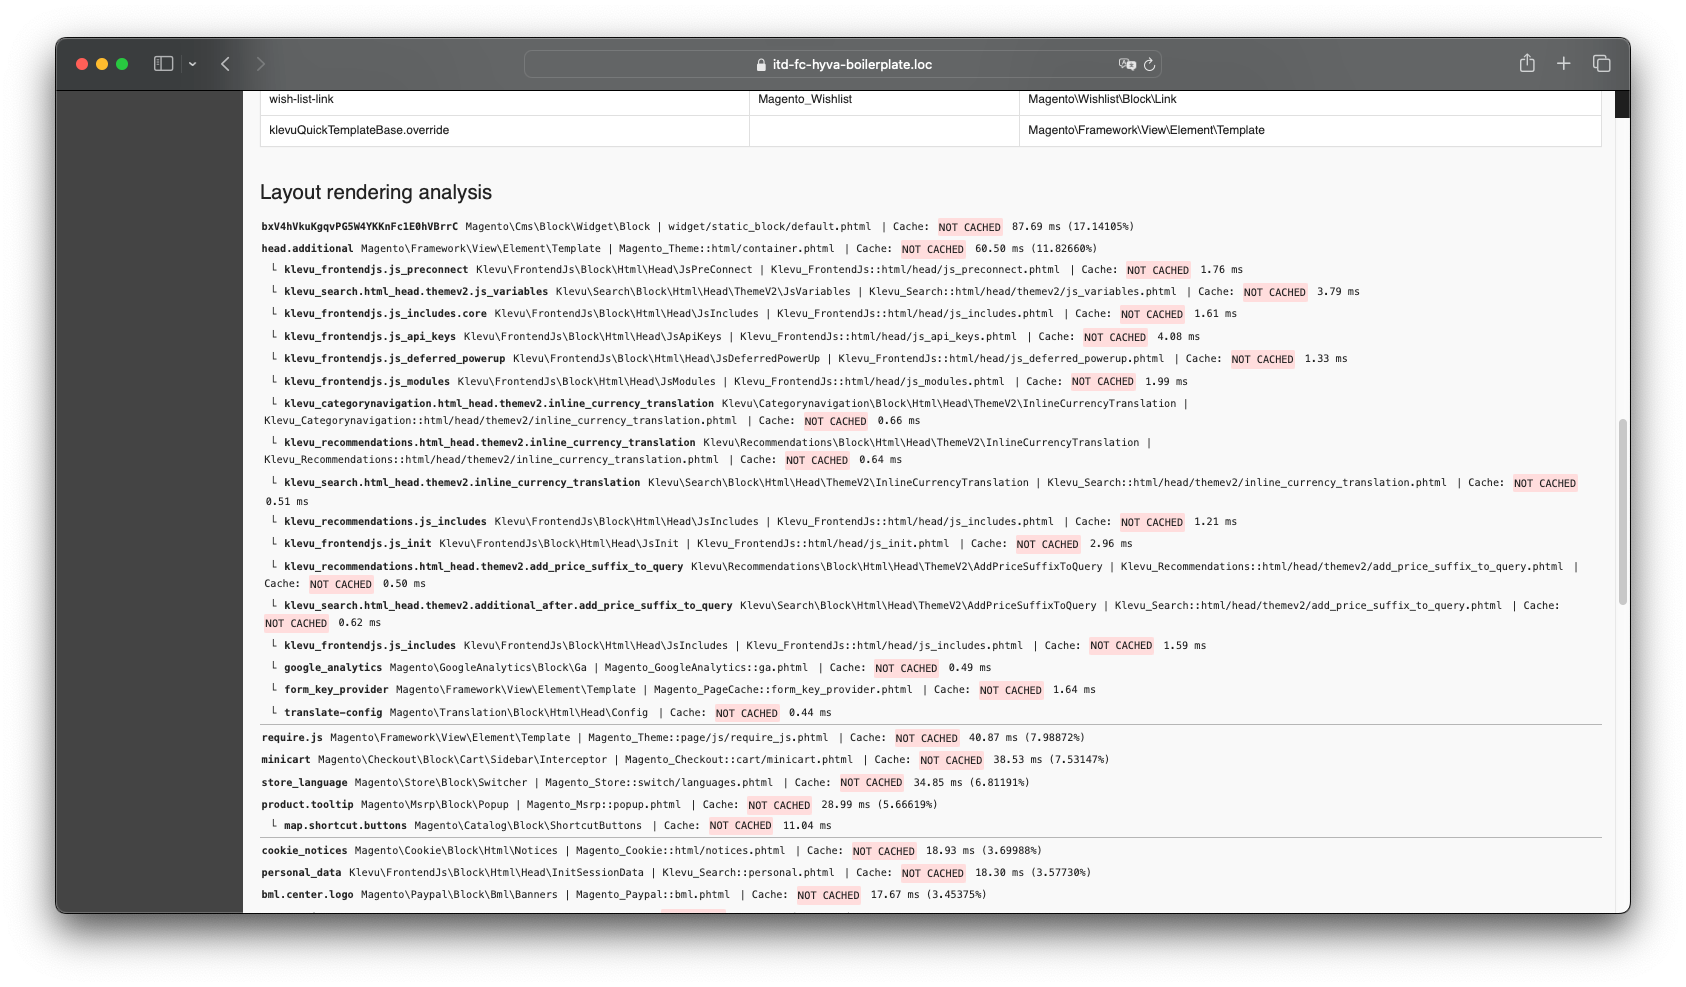


Attention - if you see that blocks are not cached, this is not a debugger error! Please make sure your block has cache_lifetime.
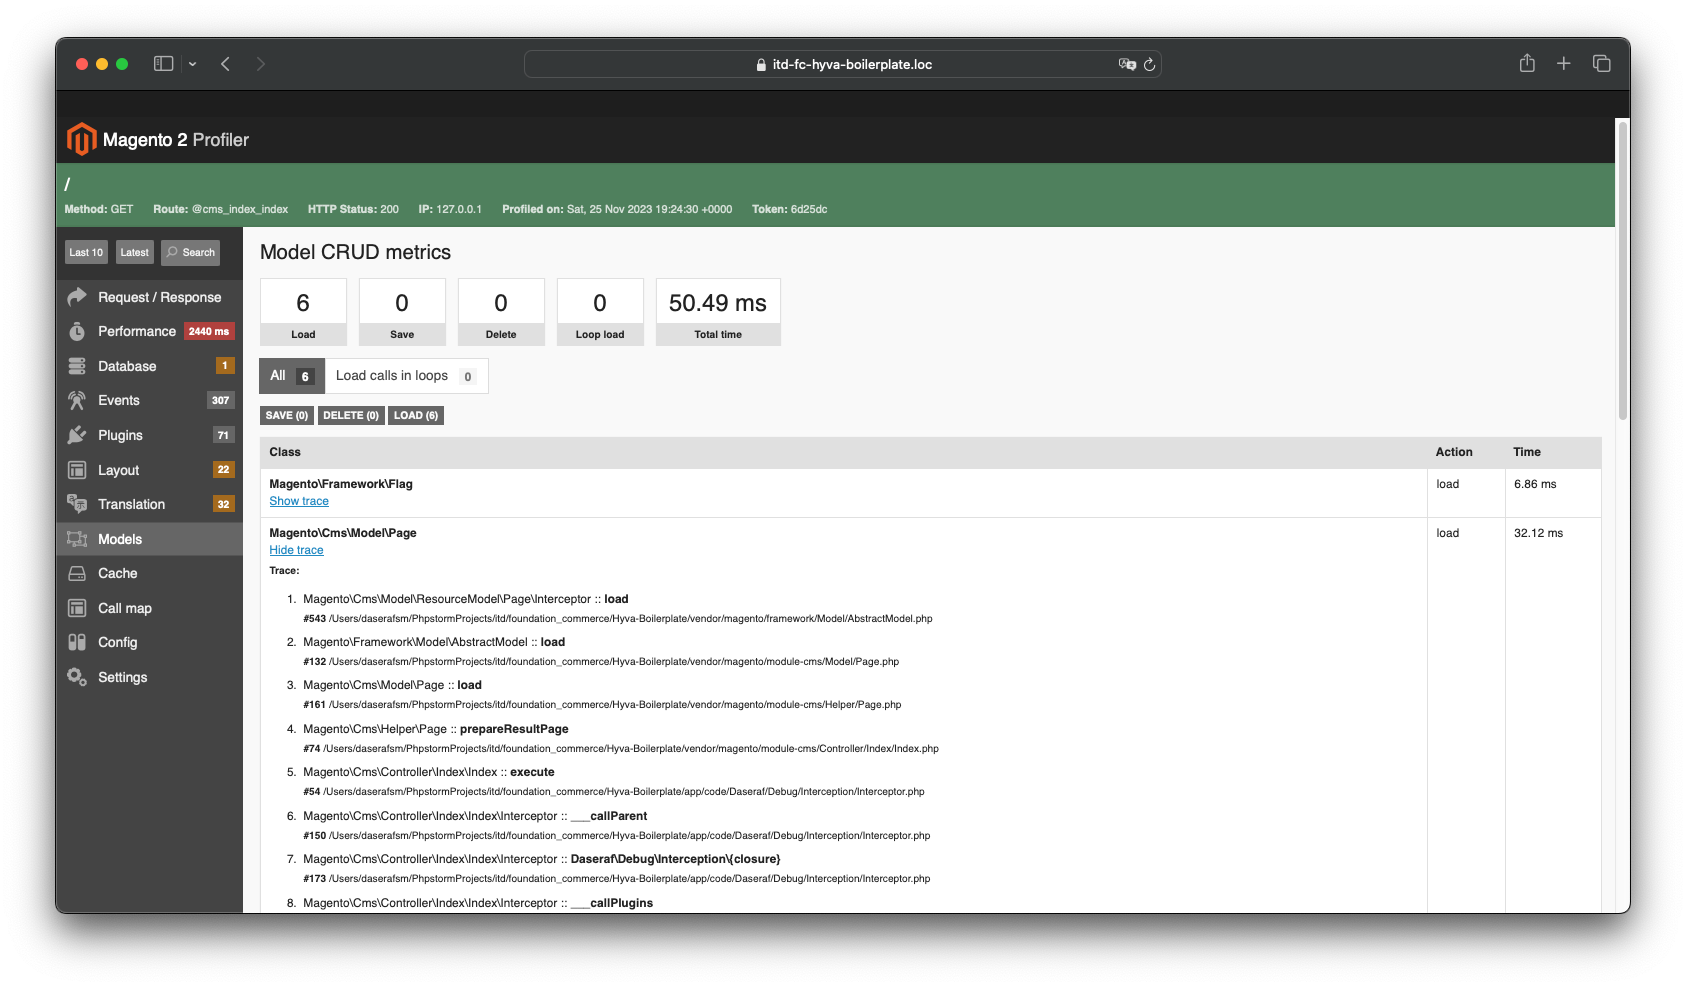
- Models - Displays loaded entity modules and the number of reloads without accessing the cache
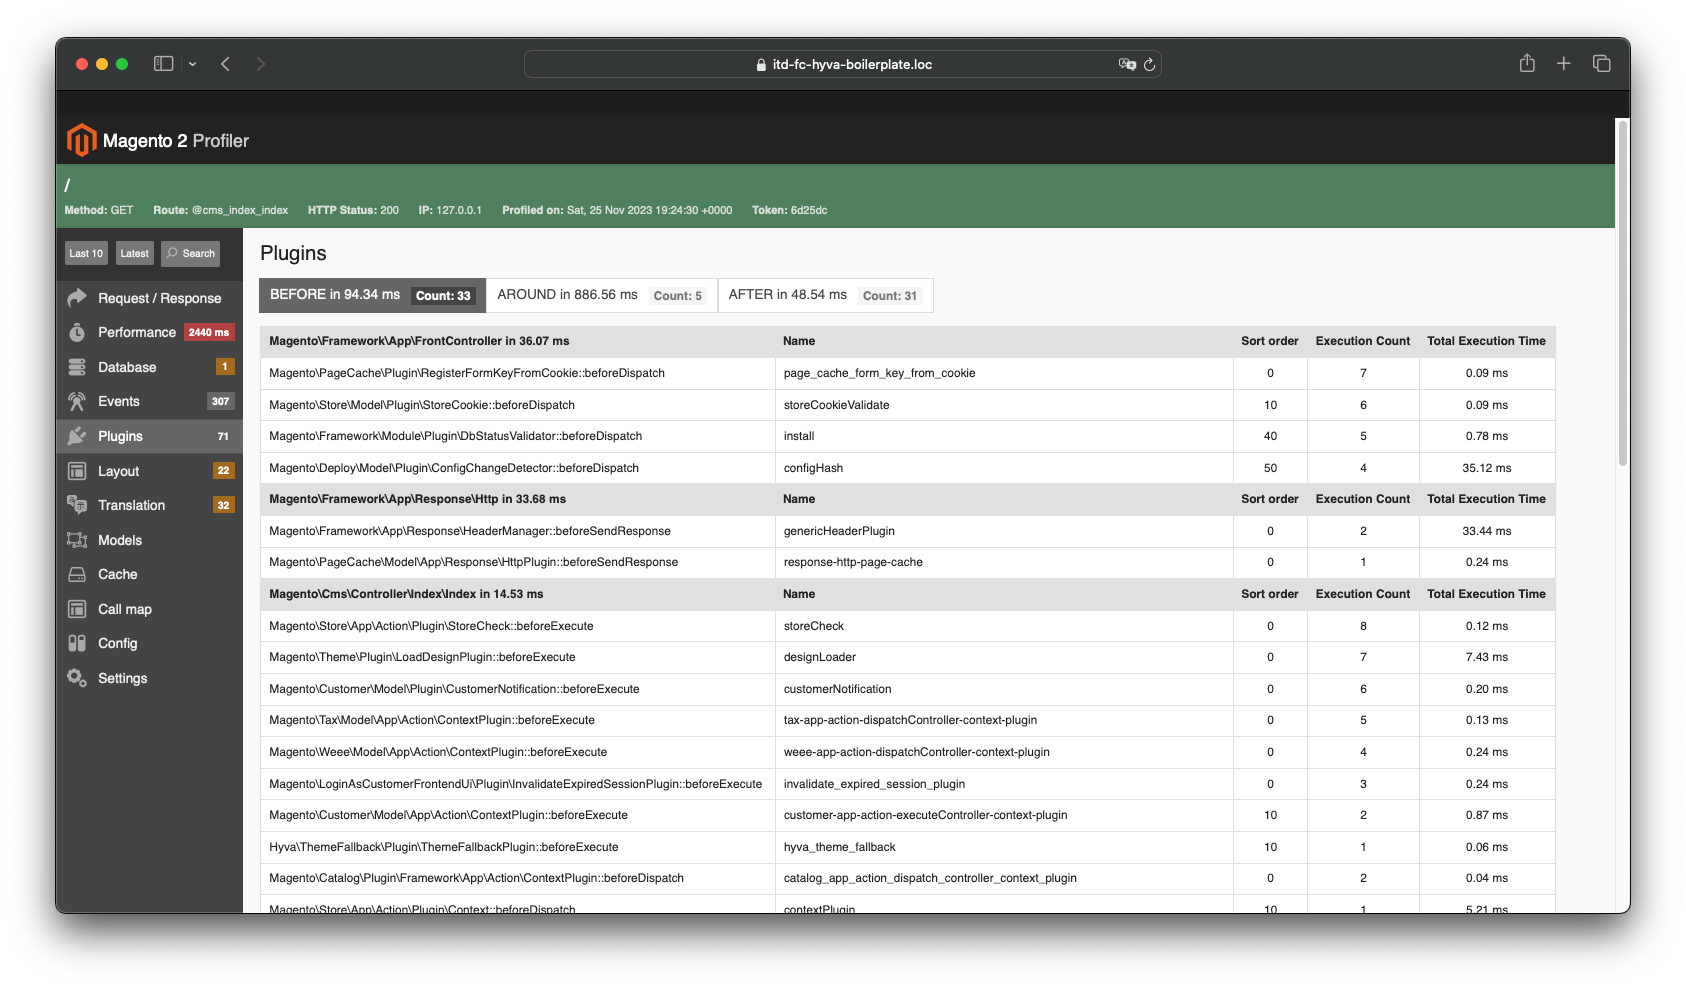
- Plugins - Shows the plugins that were called during the process, as well as the time spent on their work. Attention - the execution time of around plugins includes the execution time of all functions that will be called in the body of the plugin. Is not an error
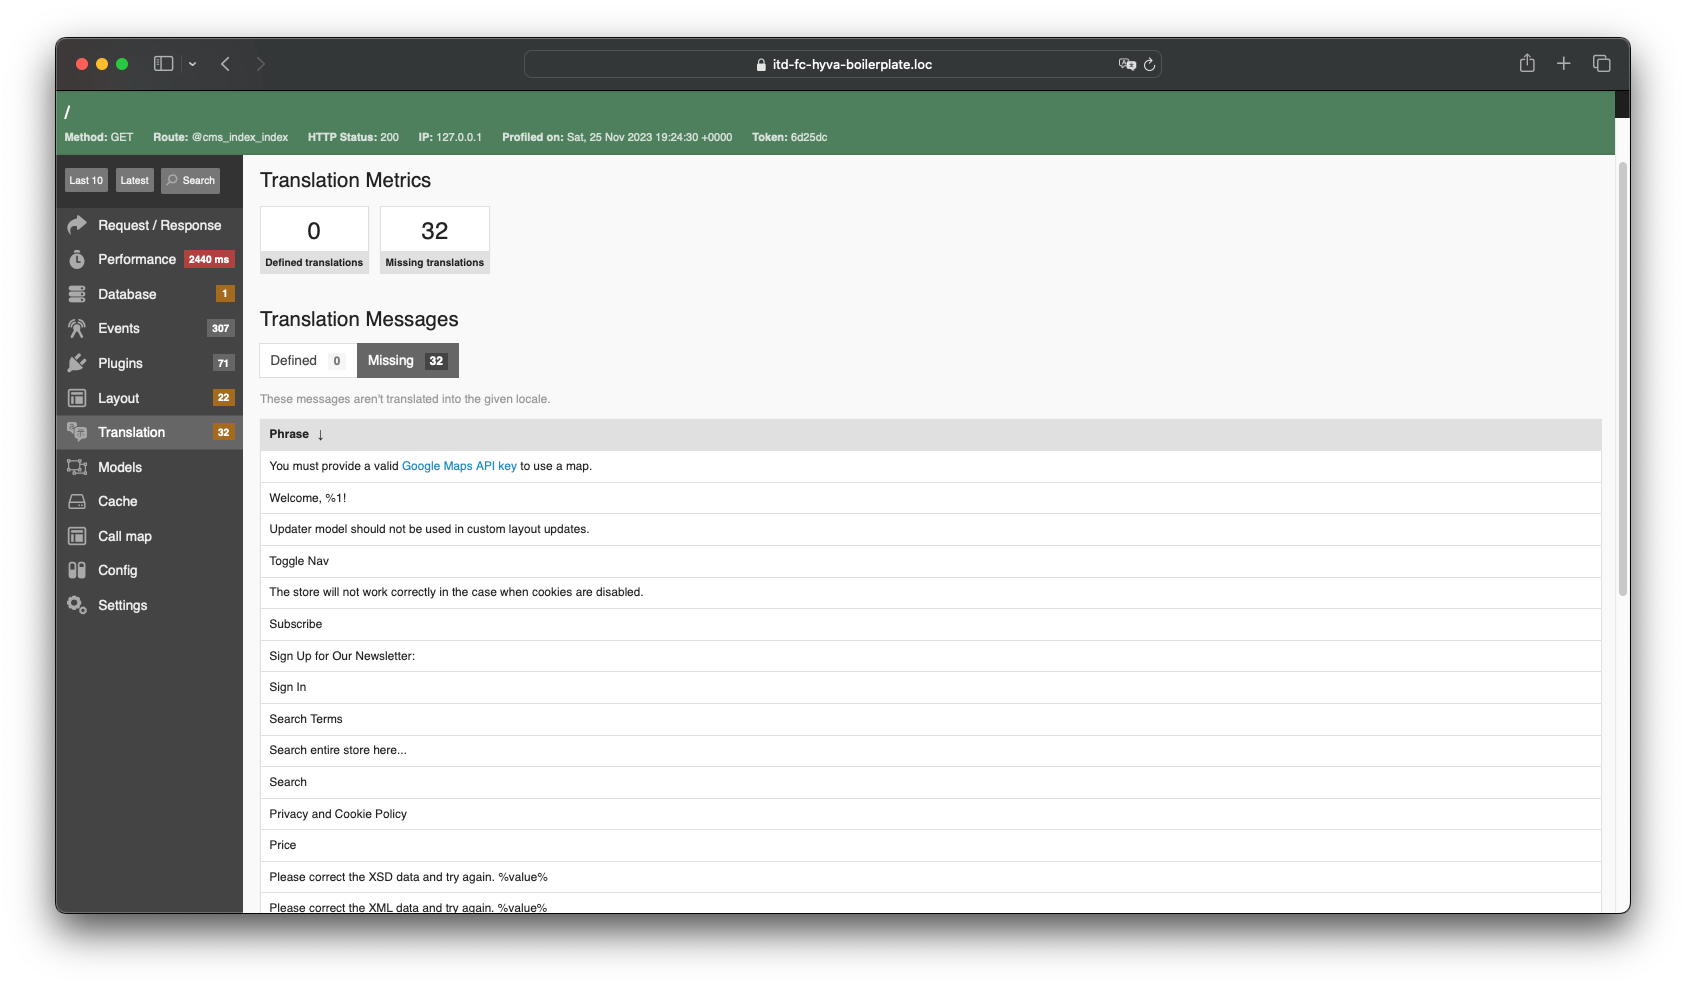
- Translations - here you can see all messages for which translation is missing
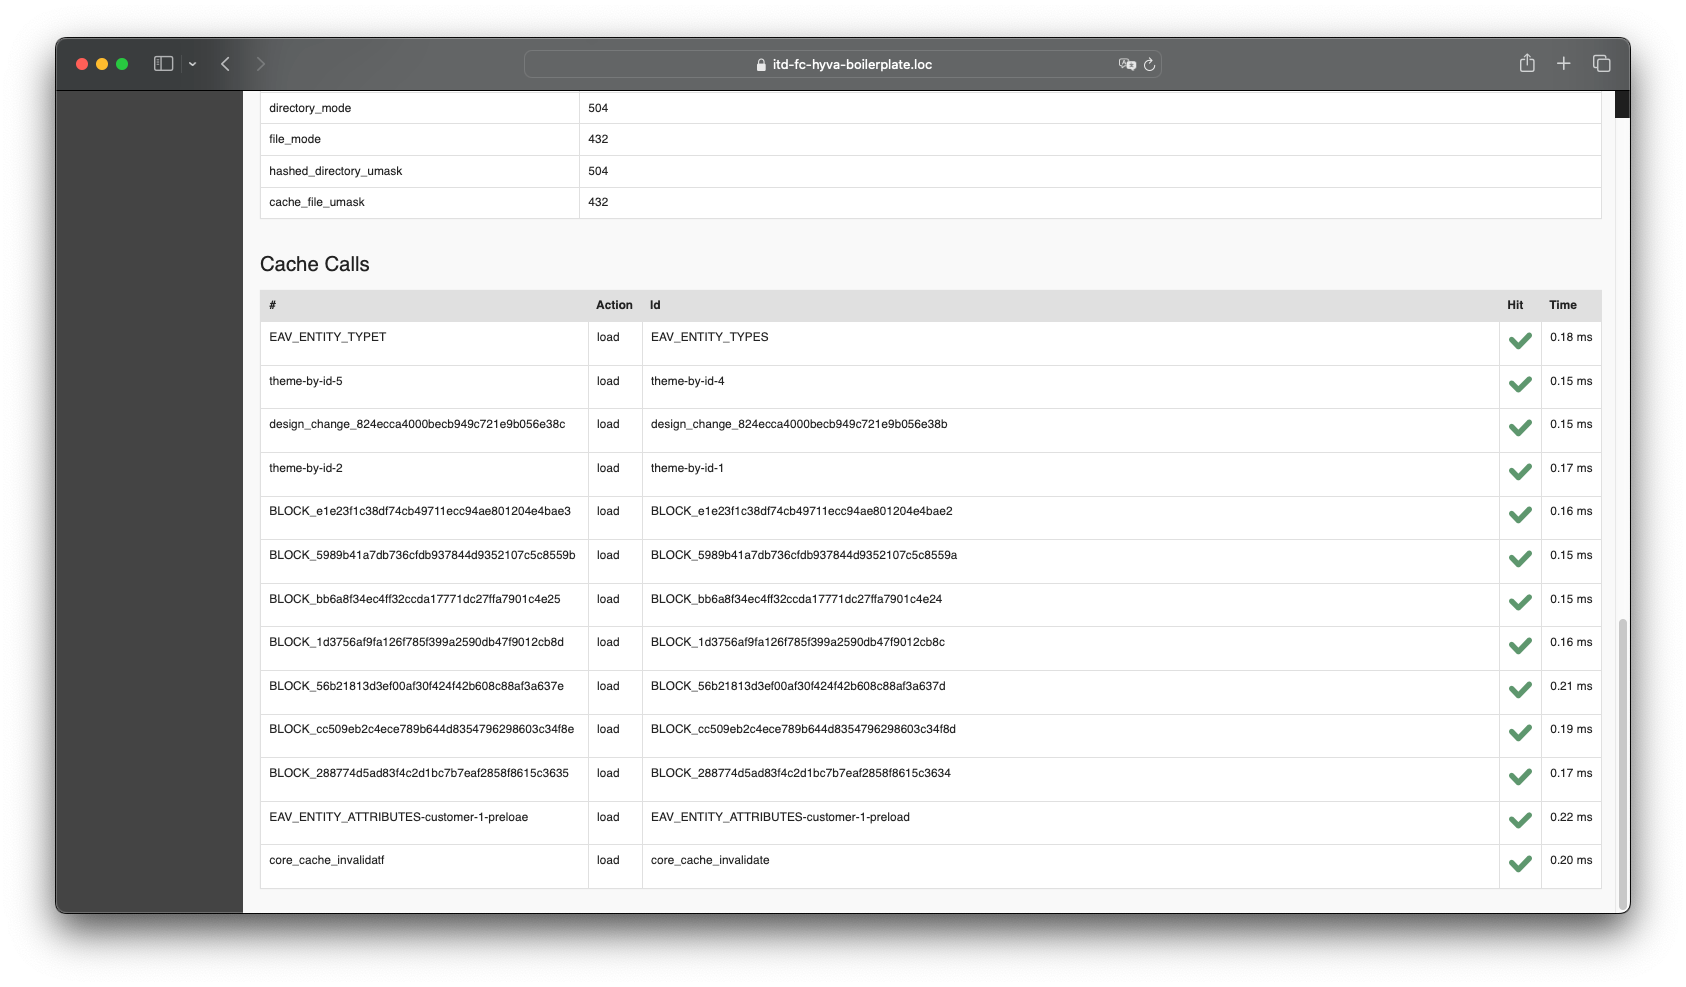
- Cache (Status and Calls) - This tab displays all successful cache calls (cacheKey is displayed in the table)
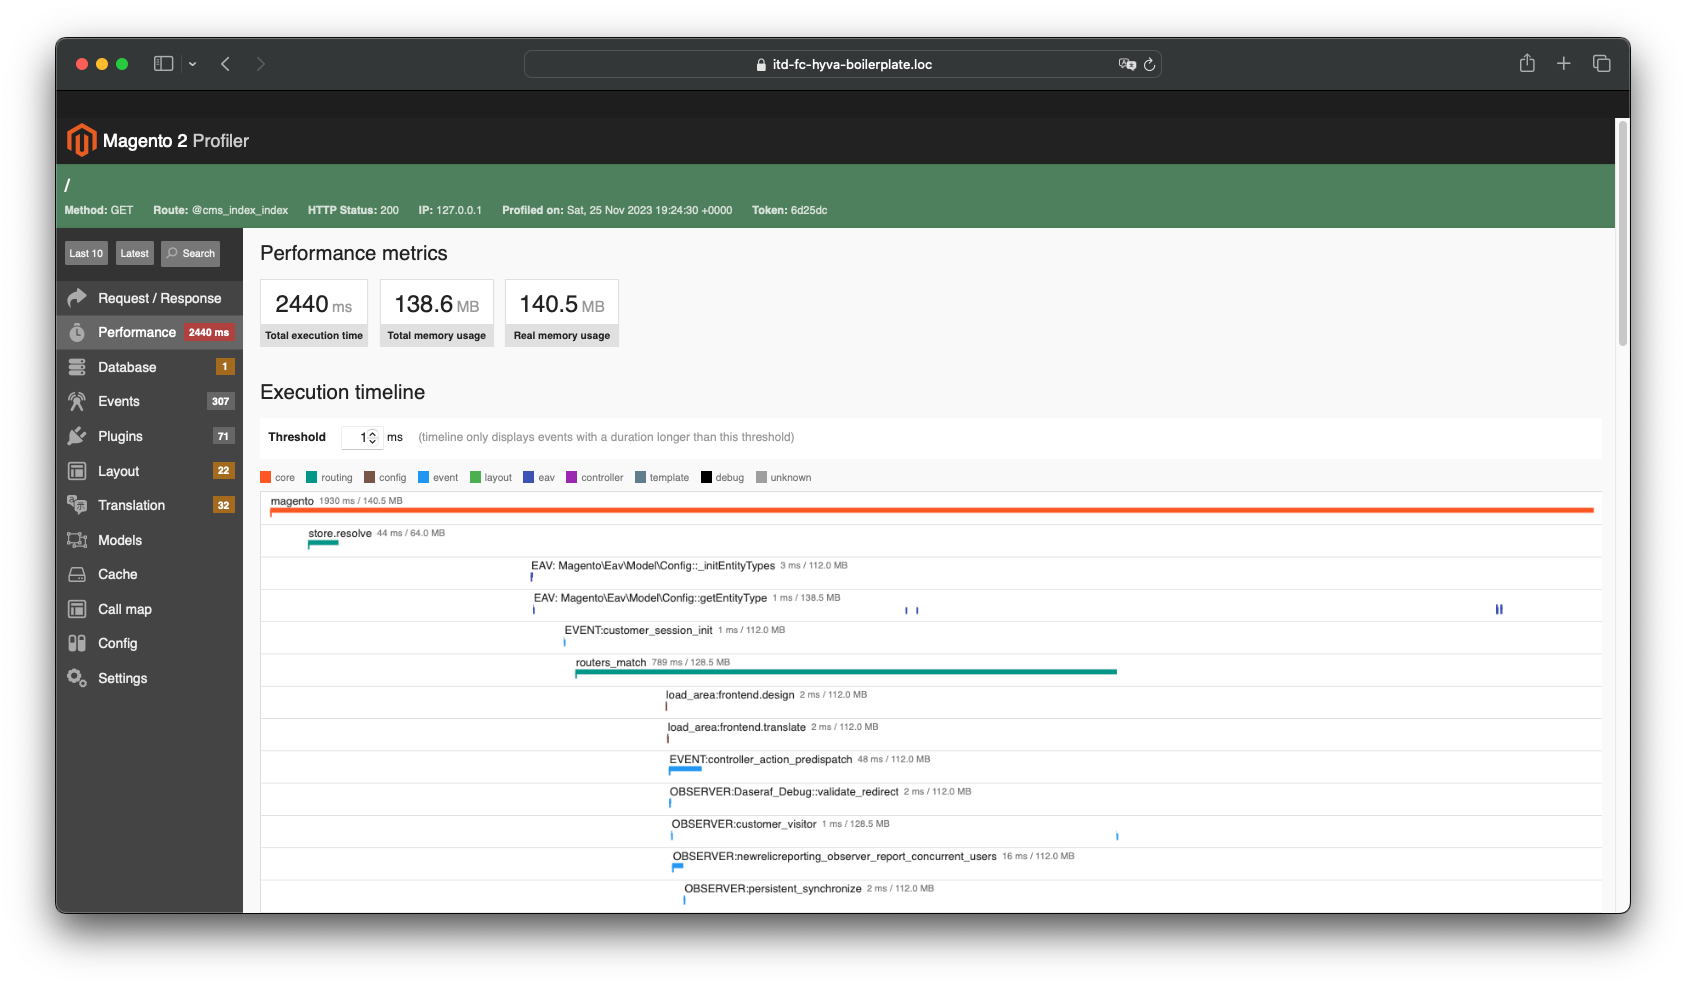
- Performance - here you can find a graph that is based on the output of the standard profiler from magento
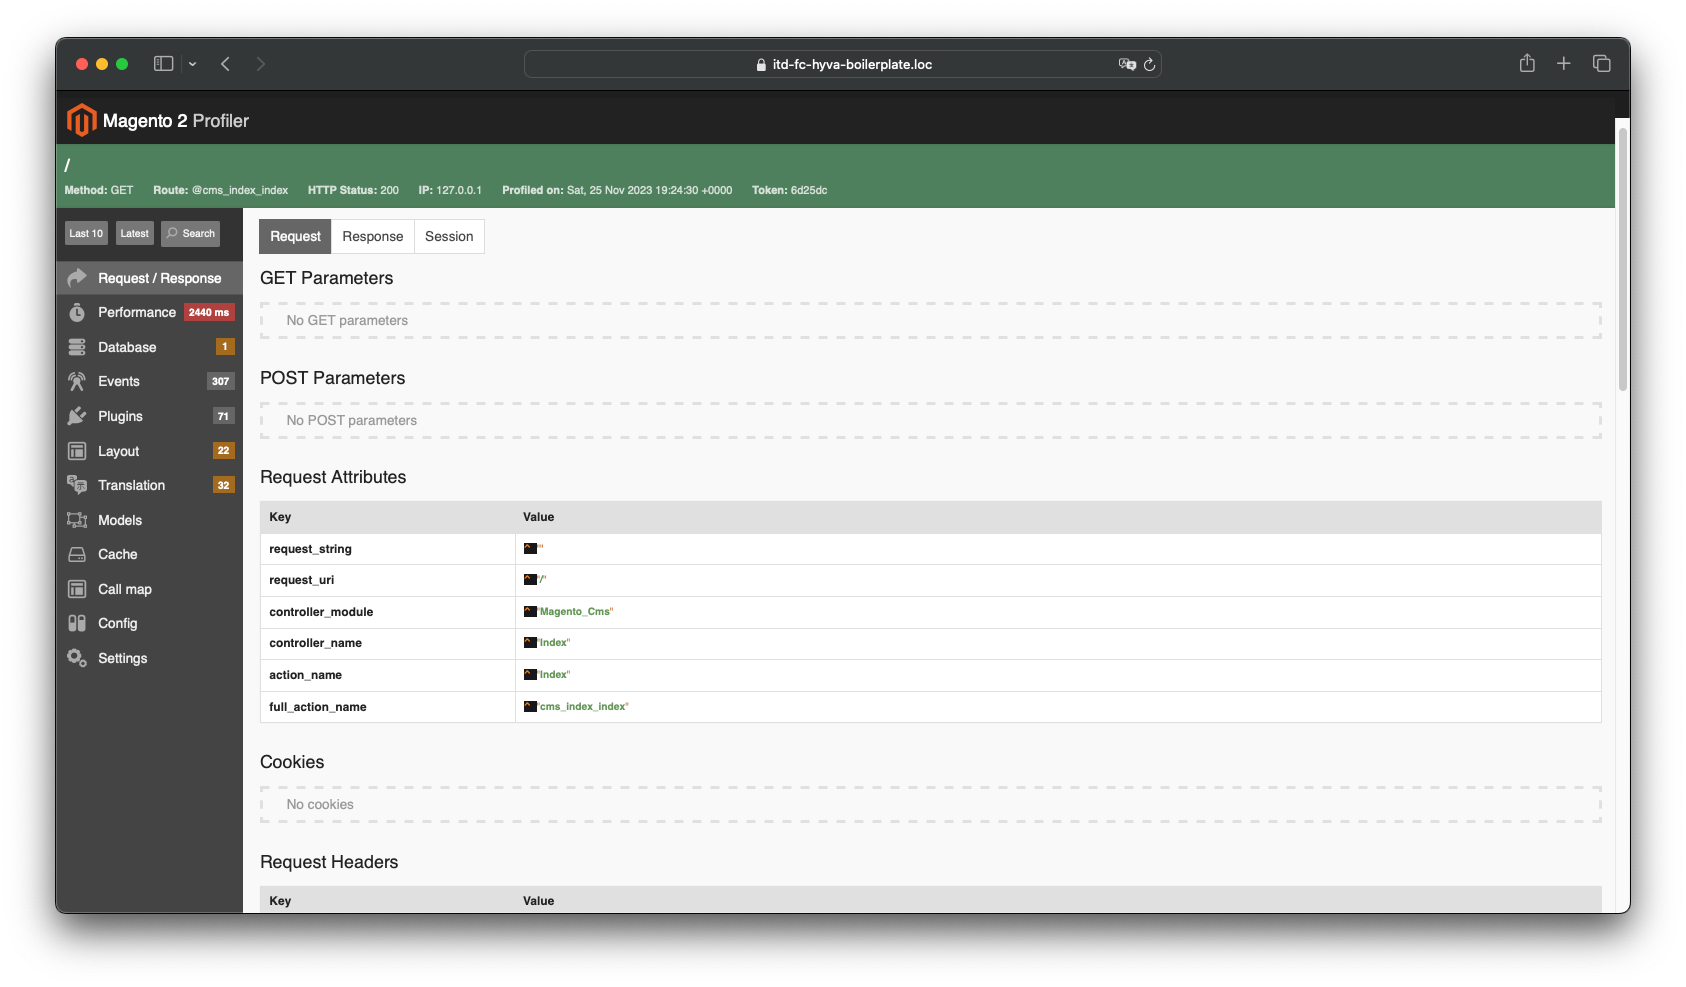
- Request/Response
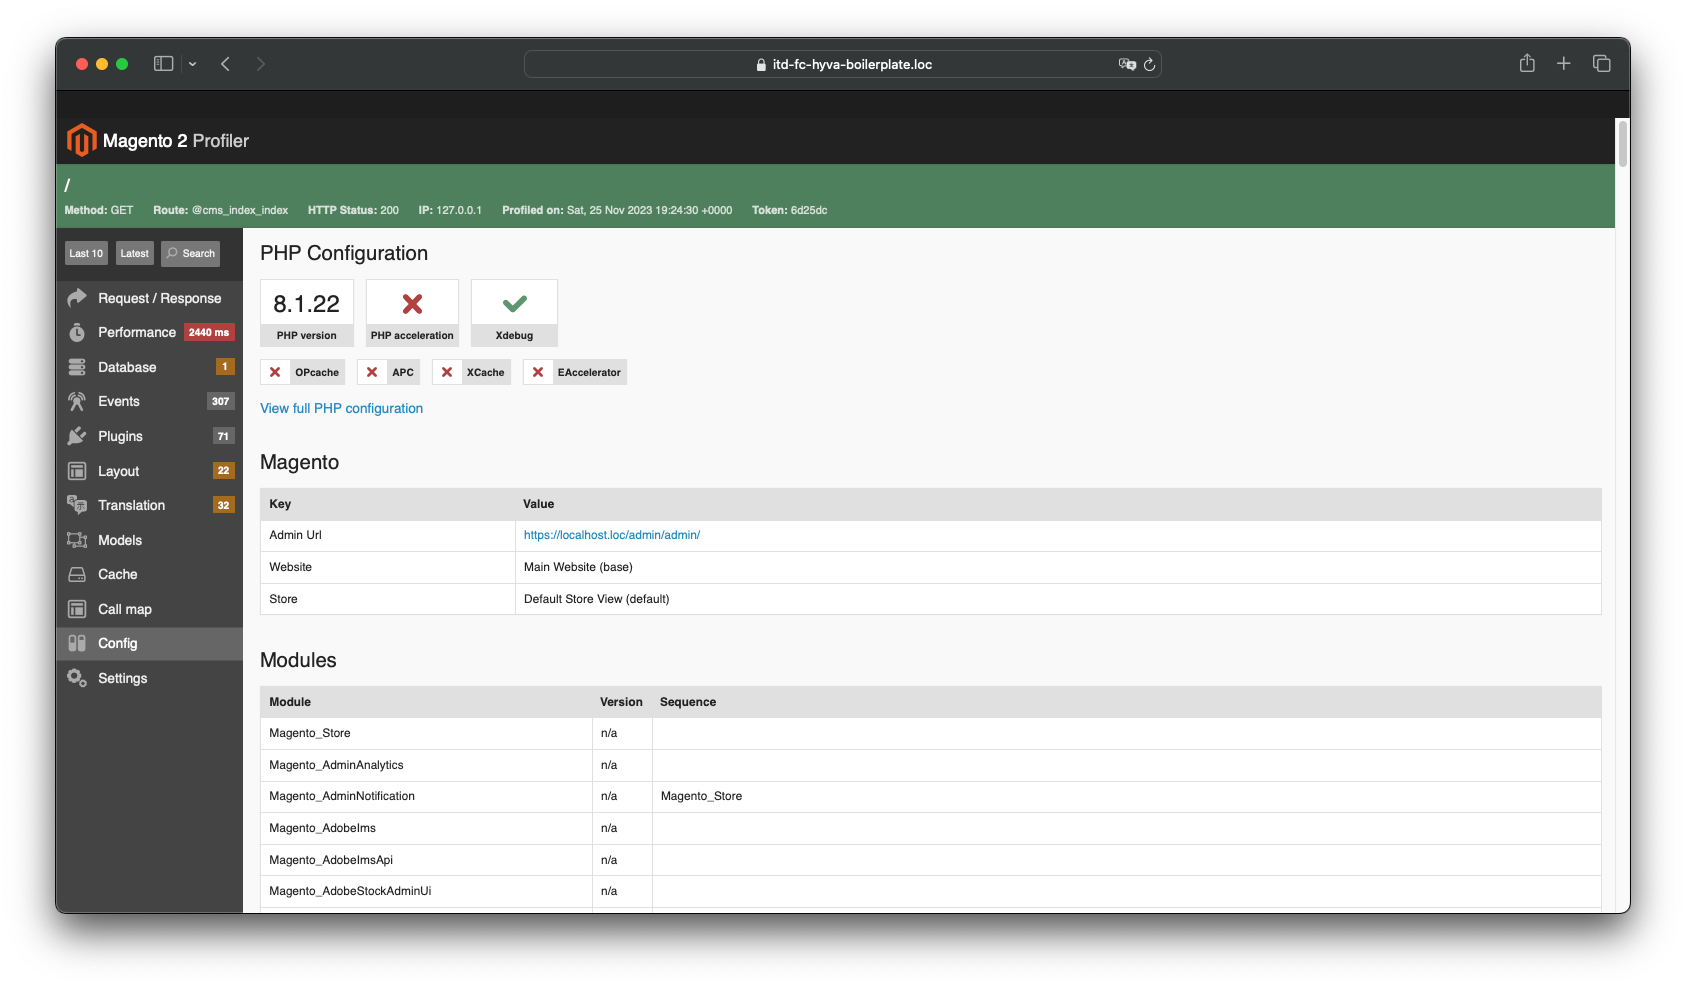
- Config
- Memory