wp-statistics / pchart
A PHP Class to build Charts
Installs: 29 310
Dependents: 0
Suggesters: 0
Security: 0
Stars: 13
Watchers: 6
Forks: 1
Open Issues: 0
pkg:composer/wp-statistics/pchart
Requires
- php: >=5.4.0
README
A PHP Class to build Charts
pChart is a PHP class oriented framework designed to create aliased charts. Most of todays chart libraries have a cost, our project is intended to be free. Data can be retrieved from SQL queries, CSV files, or manually provided. This project is still under development and new features or fix are made every week.
As the primary author of pChart has not updated it since January 19th, 2014, we decided to update the library due to some out-of-date functions.
Installation
The preferred way to install this extension is through composer.
Either run
composer require wp-statistics/pchart
to the require section of your composer.json file.
Usage
Let's add into config in your main-local config file before return[]
<?php
require_once __DIR__ . '/../vendor/autoload.php'; // Autoload files using Composer autoload

use pChart\pData;
use pChart\pChart;
use pChart\pCache;

// Dataset definition
$DataSet = new pData;
$DataSet->AddPoint(array(1, 4, 3, 2, 3, 3, 2, 1, 0, 7, 4, 3, 2, 3, 3, 5, 1, 0, 7));
$DataSet->AddSerie();
$DataSet->SetSerieName("Sample data", "Serie1");

// Initialise the graph
$Test = new pChart(700, 230);
$Test->setFontProperties("Fonts/tahoma.ttf", 10);
$Test->setGraphArea(40, 30, 680, 200);
$Test->drawGraphArea(252, 252, 252, TRUE);
$Test->drawScale($DataSet->GetData(), $DataSet->GetDataDescription(), SCALE_NORMAL, 150, 150, 150, TRUE, 0, 2);
$Test->drawGrid(4, TRUE, 230, 230, 230, 70);

// Draw the line graph
$Test->drawLineGraph($DataSet->GetData(), $DataSet->GetDataDescription());
$Test->drawPlotGraph($DataSet->GetData(), $DataSet->GetDataDescription(), 3, 2, 255, 255, 255);

// Finish the graph
$Test->setFontProperties("Fonts/tahoma.ttf", 8);
$Test->drawLegend(45, 35, $DataSet->GetDataDescription(), 255, 255, 255);
$Test->setFontProperties("Fonts/tahoma.ttf", 10);
$Test->drawTitle(60, 22, "My pretty graph", 50, 50, 50, 585);
$Test->Render("Naked.png");
Screenshots
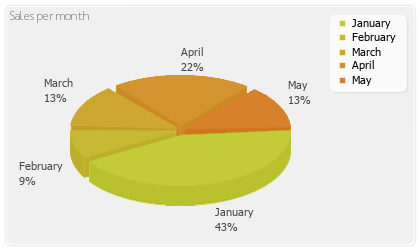
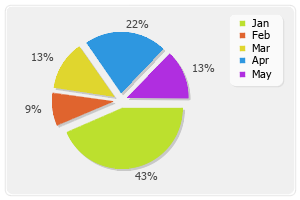
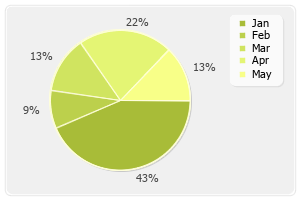
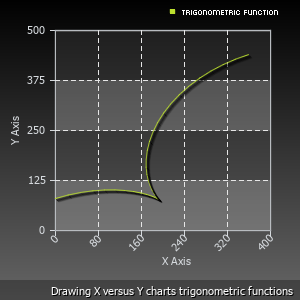
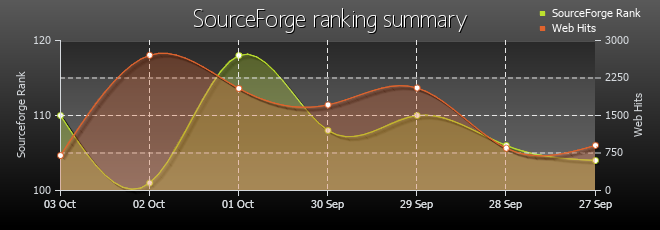
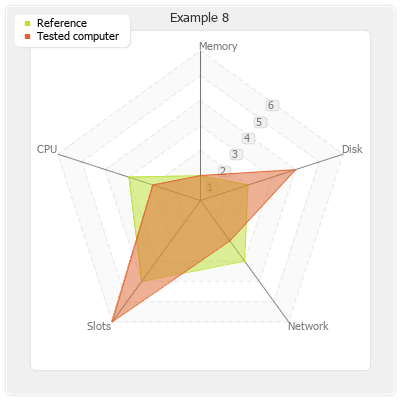
The pChart charting library is providing many ways to reprensent a single or multiple series of data. We'll try to add screenshots everytime an interesting functionnality is added to the pChart library.
