phpner / laravel-profiler
Laravel package for measuring and logging memory usage and execution time
Requires
- php: >=8.1
- illuminate/support: ^10.0|^11.0|^12.0
Requires (Dev)
- orchestra/testbench: ^9.0|^8.0
- phpunit/phpunit: ^10.3|^11.0|^12.0
README
Measure peak memory and execution time in your Laravel app — for HTTP requests and Artisan commands. Ships with headers, logs, and optional Telescope integration.
Features
- 🔎 Precise metrics: duration (ms), start/end/peak memory and memory diff.
- 🌐 HTTP profiling via middleware + optional response headers:
X-Memory-Peak,X-Duration-ms. - 🧰 Artisan profiling via a simple trait wrapper.
- 🧱 Manual spans (start/stop) via the service or facade.
- 🪵 Pluggable outputs: app log, Laravel Telescope (or both).
- 🎚️ Threshold: only log when peak memory exceeds N bytes.
Requirements
- PHP >= 8.1
- Laravel 10.x / 11.x / 12.x
Installation
composer require phpner/laravel-profiler
php artisan vendor:publish --tag=config --provider="Phpner\\MemoryProfiler\\MemoryProfilerServiceProvider"
This publishes config/laravel-memory-profiler.php.
Quick start
HTTP requests
Register the middleware (global or route group):
// app/Http/Kernel.php
protected $middleware = [
    // ...
    \Phpner\MemoryProfiler\Middleware\HttpProfiler::class,
];
When enabled, each request will:
- write a log entry with metrics and request context;
- (optionally) add headers
X-Memory-PeakandX-Duration-msto the response.
Artisan commands
Wrap your command logic with the provided trait:
use Illuminate\Console\Command;
use Phpner\MemoryProfiler\Console\Concerns\ProfilesMemory;

class ImportUsers extends Command
{
    use ProfilesMemory;

    protected $signature = 'users:import';

    public function handle(): int
    {
        return $this->withMemoryProfiling(function () {
            // your command logic
            $this->info('Importing...');
            // ...
            return 0; // exit code
        });
    }
}
The profiler will log command name and exit code along with metrics.
Manual spans
Use the service (DI) or the facade to measure any piece of code.
use Phpner\MemoryProfiler\MemoryProfiler; // service
use Phpner\MemoryProfiler\Facades\MemoryProfiler as MP; // facade

// 1) Service
public function show(MemoryProfiler $profiler)
{
    $ctx = $profiler->start('code');
    // ... your code ...
    $profiler->stop($ctx, [
        'label' => 'users.show',
        'meta'  => ['id' => 42],
    ]);
}

// 2) Facade
$ctx = MP::start('code');
// expensive work
MP::stop($ctx, ['label' => 'expensive.segment']);
Configuration
config/laravel-memory-profiler.php:
return [
    'enabled'          => env('MEMORY_PROFILER_ENABLED', true),
    'driver'           => env('MEMORY_PROFILER_DRIVER', 'log'), // log | telescope | both
    'threshold'        => env('MEMORY_PROFILER_THRESHOLD', 0),  // bytes; 0 = log everything
    'response_headers' => env('MEMORY_PROFILER_HEADERS', true),
];
Common .env options
MEMORY_PROFILER_ENABLED=true
MEMORY_PROFILER_DRIVER=both     # log | telescope | both
MEMORY_PROFILER_THRESHOLD=0     # e.g. 2097152 (2 MB)
MEMORY_PROFILER_HEADERS=true
Output
Response headers (HTTP)
X-Memory-Peak: 1048576
X-Duration-ms: 123
Log entry (example)
{
  "duration_ms": 123,
  "memory_start": 524288,
  "memory_end": 786432,
  "memory_peak": 1048576,
  "memory_diff": 262144,
  "type": "http",          // or "artisan" / "code"
  "label": "users.show",   // when provided for manual spans
  "method": "GET",
  "path": "api/users/42",
  "route": "users.show",
  "status": 200
}
Telescope (optional)
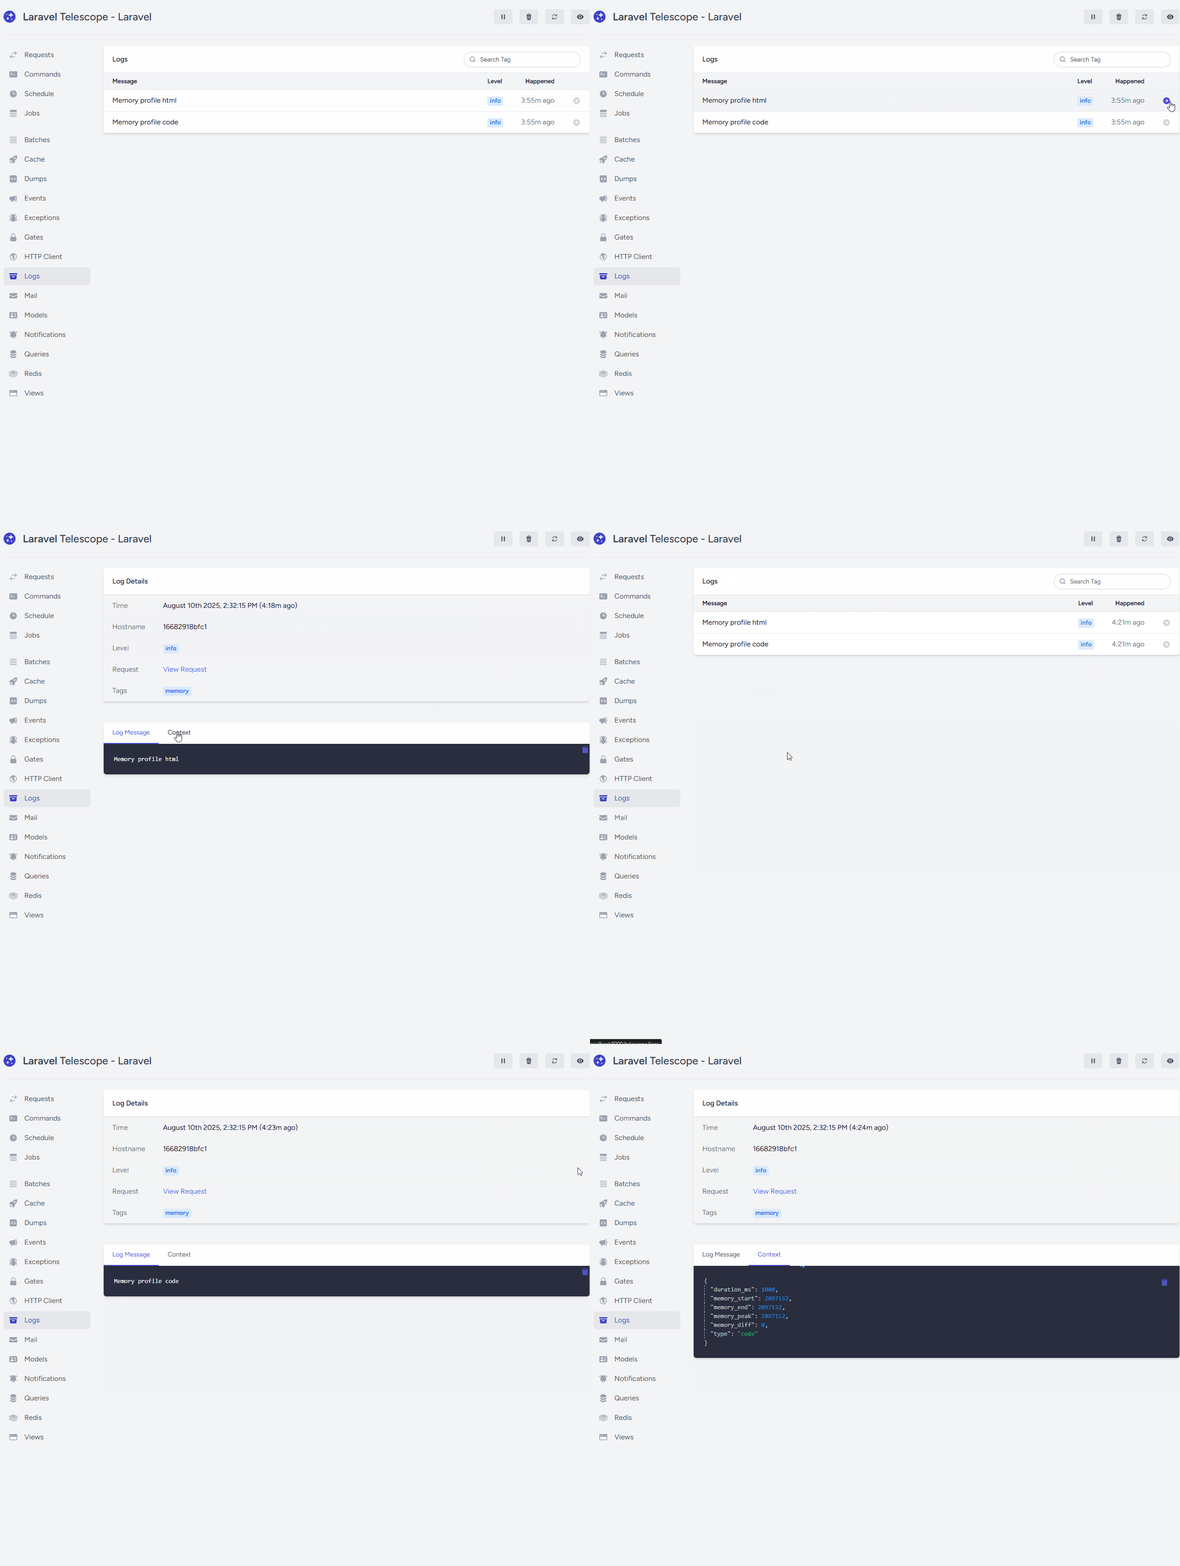
Set MEMORY_PROFILER_DRIVER=telescope or both. Entries appear in Telescope Log section with the memory tag.
Why this package?
- Lightweight and framework-native.
- Zero vendor lock‑in: works with logs you already collect; Telescope is optional.
- Transparent: you decide where to profile (global, group, specific commands, or manual spans).
Tips
- Start with
threshold=0in dev to see everything; raise it in prod to reduce noise. - Put the middleware only on routes you care about if you want a narrower focus.
- Pair with request IDs/correlation IDs in your logger to join app logs and memory profiles.
Roadmap
- Queue job middleware.
- Blade/Laravel Debugbar-like panel.
- Per-route configuration overrides.
Contributing
PRs and issues are welcome! Please include tests where it makes sense.
License
Released under the MIT License.

