marzzelo / graph
Little cartesian graphics generator
Installs: 39
Dependents: 0
Suggesters: 0
Security: 0
Stars: 1
Watchers: 1
Forks: 0
Open Issues: 0
pkg:composer/marzzelo/graph
Requires
- php: >=8.0
- intervention/image: ^2.5
Requires (Dev)
- orchestra/testbench: ^8.0
- phpunit/phpunit: ^9.5
README
Marzzelo/Graph is a simple Cartesian Graph creation library in PHP, with Laravel support.
Features
Installation
Use Composer to install Graph from Packagist
composer require marzzelo/graph
Basic Usage
- Define the datasets to plot in the form:
$data = [[x0,y0], [x1,y1], ...]
protected function getTestData(): array
{
    $data1 = [[-1500, 1000], [-1000, 800], [-500, 100], [0, -100], [1000, 900], [1500, 1200]];
    $data2 = [[-1500, 1200], [-1000, 1000], [-500, 200], [0, 0], [1000, 1100], [1500, 1400]];
    ...
    $dataN = [...];
    return [$data1, $data2, ... $dataN];
}
You can define your own data format, implementing the IDataSet interface. See below for an example.
In the basic usage, you can call the fromArray or the fromCSV methods, using the Graph facade:
use Marzzelo\Graph\Facades\Graph;

$data = $this->getTestData();
$graph = Graph::fromArray($data);
Finally, you can use the save method to save the graph to a file, or the render64 method to get the image content as a base64 string:
// to render:
$img64 = $graph->render64('png');
// view: <img src="{{ $graph }}" alt='' />
// to save to disk:
$graph->save('graph/testgraph.png');
Using the fromCSV method, you can create a graph from a CSV file:
$graph = Graph::fromCSV('data.csv');
The CSV file must contain the column names in the first line and the data in the following lines. The first column must contain the independent variable and the following columns must contain the dependent variables. The separator character can be specified in the $options array (default is comma):
$graph = Graph::fromCSV('data.csv', ['separator' => ',']);
There are also a lot of configuration options that can be passed to the fromArray and fromCSV methods:
$options = [
    'frame' => [
        'width-px'         => 640,
        'height-px'        => 480,
        'background-color' => '#FFF',
        'frame-color'      => '#777',
    ],

    'axis' => [
        'grid-size-xy'           => [null, null], // in physical units
        'labels'                 => [null, null], // axis labels
        'margin'                 => 20, // can be array [x, y] or int
        'title'                  => '',
        'title-color'            => null,  // takes a contrasting color from 'background-color'
        'title-background-color' => null,  // takes 'background-color' darken by 20%
        'axis-color'             => '#555', // color of axis lines
        'grid-color'             => '#ddd',
        'labels-color'           => '#777',
    ],

    // array of dataset settings, one for each dataset.
    // if not specified, the default values are used.
    'datasets' => [[
        'line-color'    => '#00A',
        'marker-radius' => 0,
        'marker-color'  => '#00A',
    ]],

    'csv'  => [
        'delimiter' => ',',
        'skip'      => 0,  // number of lines to skip
    ],
];
Laravel support
If you don't specify the 'datasets' option, default values are used. Default values can be customized, publishing the config file:
php artisan vendor:publish --provider="Marzzelo\Graph\GraphServiceProvider" --tag="config"
Or, ommit the parameters and select the config file from the list:
php artisan vendor:publish
The published config file is located in config/graph.php.
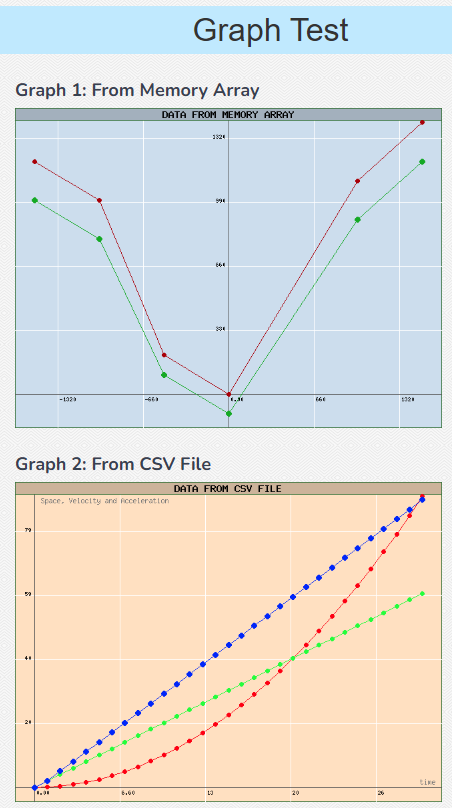
A route to a test page has been implemented, so you can test the library with a simple web page.
The default route is /graph-test and the page looks like this:

php artisan vendor:publish --provider="Marzzelo\Graph\GraphServiceProvider" --tag="marzzelo:graph-config"
You can change the route, publishing the config file and editing the route parameter.
You can also customize the view, publishing the view file:
php artisan vendor:publish --provider="Marzzelo\Graph\GraphServiceProvider" --tag="marzzelo:graph-views"
The published view file is located in resources/views/vendor/graph/graph-test.blade.php.
You can customize the datasets used for generating the test graph, publishing the assets file:
php artisan vendor:publish --provider="Marzzelo\Graph\GraphServiceProvider" --tag="marzzelo:graph-assets"
The published assets file is located in public/vendor/graph/assets.
Messages and Errors are in English and Spanish. You can customize the messages, publishing the lang file:
php artisan vendor:publish --provider="Marzzelo\Graph\GraphServiceProvider" --tag="marzzelo:graph-translations"
The published lang file is located in resources/lang/vendor/graph.
Advanced Usage
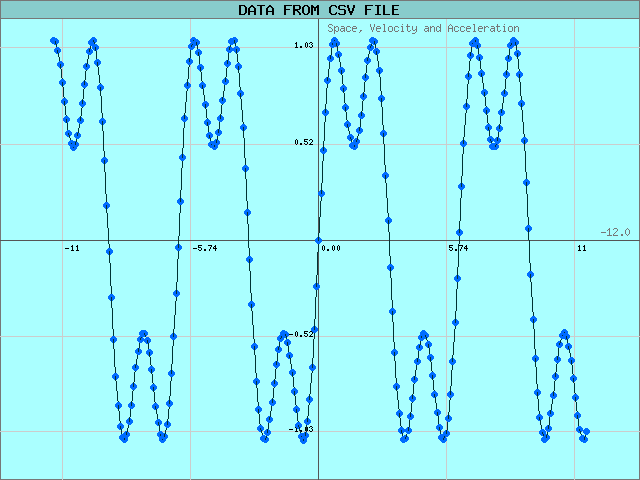
Using options, you can customize the graph appearance:
$graph = Graph::fromCSV('data.csv', $options);
The output graph looks like this:

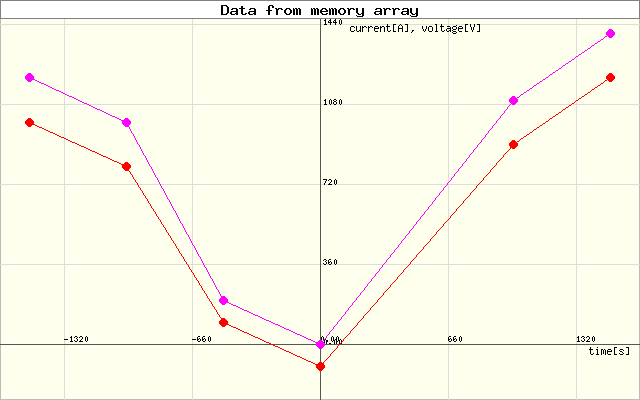
Using custom data format, Axis and Frames
- Create the datasets using the class DataSet. Optionally, you can define the marker radius and line color.
$dataset1 = new DataSet($data1, 6, '#070');
$dataset2 = new DataSet($data2, 8, '#600');
...
$datasetN = new DataSet($dataN, 8, '#600');
- Define a frame as a canvas for the the Graph using the class Frame. Input the width, height and, optionally, background-color and border-color.
$frame = new Frame(640, 400, '#FFF', '#bbb');
- Define an Axis for the Graph (the AutoAxis concrete class is used in this example).
You can choose from the following Axis implementations or create your own one:
- AutoAxis requires all datasets to be passed in order to auto-calculate axis bounds.
- BasicAxis concrete class requires just the upper-left and lower-right points.
$axis = (new AutoAxis([$dataset1, $dataset2,... $datasetN], $frame ))
// Add labels to the Axis (optional)
        ->addLabels('time[s]', 'current[A], voltage[V]')
// Set grid spacing in physical units (optional)
        ->setGrid(200, 100);
- Define the Graph based on the axis
$graph = (new Graph($axis))
         ->addDataSets([
             $dataset1,
             $dataset2,
         ])
// Get the image to display (render64)
        ->render64('png');

// Or, save the image to a file
$graph->render()->save('graph/testgraph.png');
Then, you can use $img64 content as the image source in the <img /> html tag:
<div class=''>
    <img src="{{$graph}}" alt='' class='mx-auto' />
</div>
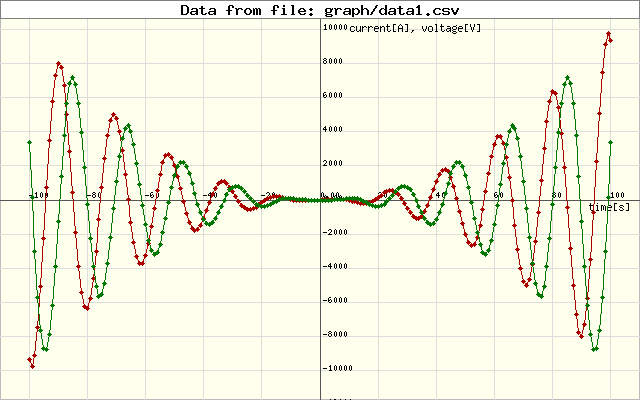
CASE 2: Data sets from a CSV file
- From a CSV file (comma separated values) you can create a CsvFileReader object.
The first line of the file must contain the column names.
The following lines must contain the data in the form:
t, I, Vwheretis the independent variable andIandVare the dependent variables. The file must be in the same directory as the script or in a subdirectory. The file name must be passed as a parameter to the constructor. The second parameter is the separator character (default is comma).
| t | I | V |
|---|---|---|
| -1500 | 1000 | 100 |
| -1000 | 800 | 80 |
| -500 | 100 | 10 |
$csvFile = new CsvFileReader('data.csv', ",");  // create the CSV file reader
$datasets = $csvFile->getDataSets(); // get the data sets

$datasets[0]->setMarker(5, '#a00'); // set marker radius and color
$datasets[1]->setMarker(5, '#070');

$frame = new Frame(640, 400);  // create the frame
$axis = (new AutoAxis($datasets, $frame ))  // create the axis
    ->addLabels('time[s]', 'current[A], voltage[V]')
    ->setGrid(200, 100);
    ->addTitle('Current and voltage vs time');

(new Graph($axis))
	->addDataSets($datasets) // add the datasets to the graph
	->render()->save('graph/testgraph.png');  // save the graph to a file
Laravel support
Installation
Don't need to install anything. Autodiscovery is enabled.
Usage
To create a Frame, use the Frame facade:
$frame = Frame::make(640, 400, '#FFF', '#bbb'); // create the frame
You can also get a Frame instance using the Graph facade:
$frame = Graph::Frame(640, 400, '#FFF', '#bbb'); // create the frame
to create the DataSets, use the DataSet facade, or the Graph facade:
$data1 = [[-1500, 1000], [-1000, 800], [-500, 100], [0, -100], [1000, 900], [1500, 1200]];
$data2 = [[-1500, 1200], [-1000, 1000], [-500, 200], [0, 0], [1000, 1100], [1500, 1400]];

$dataset1 = Graph::DataSet($data1, 8, '#F00'); // create the dataset
$dataset2 = Graph::DataSet($data2, 8, '#F0F');
Or, get the data from a CSV file using the Graph facade:
$csvFile = Graph::CsvFileReader($source, $sep);  // create the CSV file reader
$datasets = $csvFile->getDataSets(); // get the data sets
The same applies to the Axis and Graph facades:
$axis = Graph::AutoAxis([$dataset1, $dataset2], $frame, [5, 10]) // Create the axis and set the grid spacing
	->addLabels(['time[s]', 'current[A], voltage[V]']) // Add labels to the axis
	->setGrid($gridx, $gridy) // Set the grid spacing
	->addTitle($title); // Add a title to the graph
Finally, to create a Graph, use the Graph facade:
 Graph::make($axis)  // Create the graph
    ->setDataSets($this->datasets)  // Add the datasets
    ->render()->save($destination);  // Save the graph to a file
Contributing
Pull requests are welcome. For major changes, please open an issue first to discuss what you would like to change.
Please make sure to update tests as appropriate.


