fidum / laravel-dashboard-vapor-metrics-tile
Vapor environment, cache and database metrics tiles for laravel dashboard
Package info
github.com/fidum/laravel-dashboard-vapor-metrics-tile
pkg:composer/fidum/laravel-dashboard-vapor-metrics-tile
Fund package maintenance!
Requires
- php: ^8.1
- fidum/laravel-dashboard-chart-tile: ^6.0
- laravel/vapor-cli: ^1.60
- spatie/laravel-dashboard: ^3.0
Requires (Dev)
- mockery/mockery: ^1.5
- orchestra/testbench: ^8.0|^9.0|^10.0
- phpunit/phpunit: ^10.5|^11.5.3
README
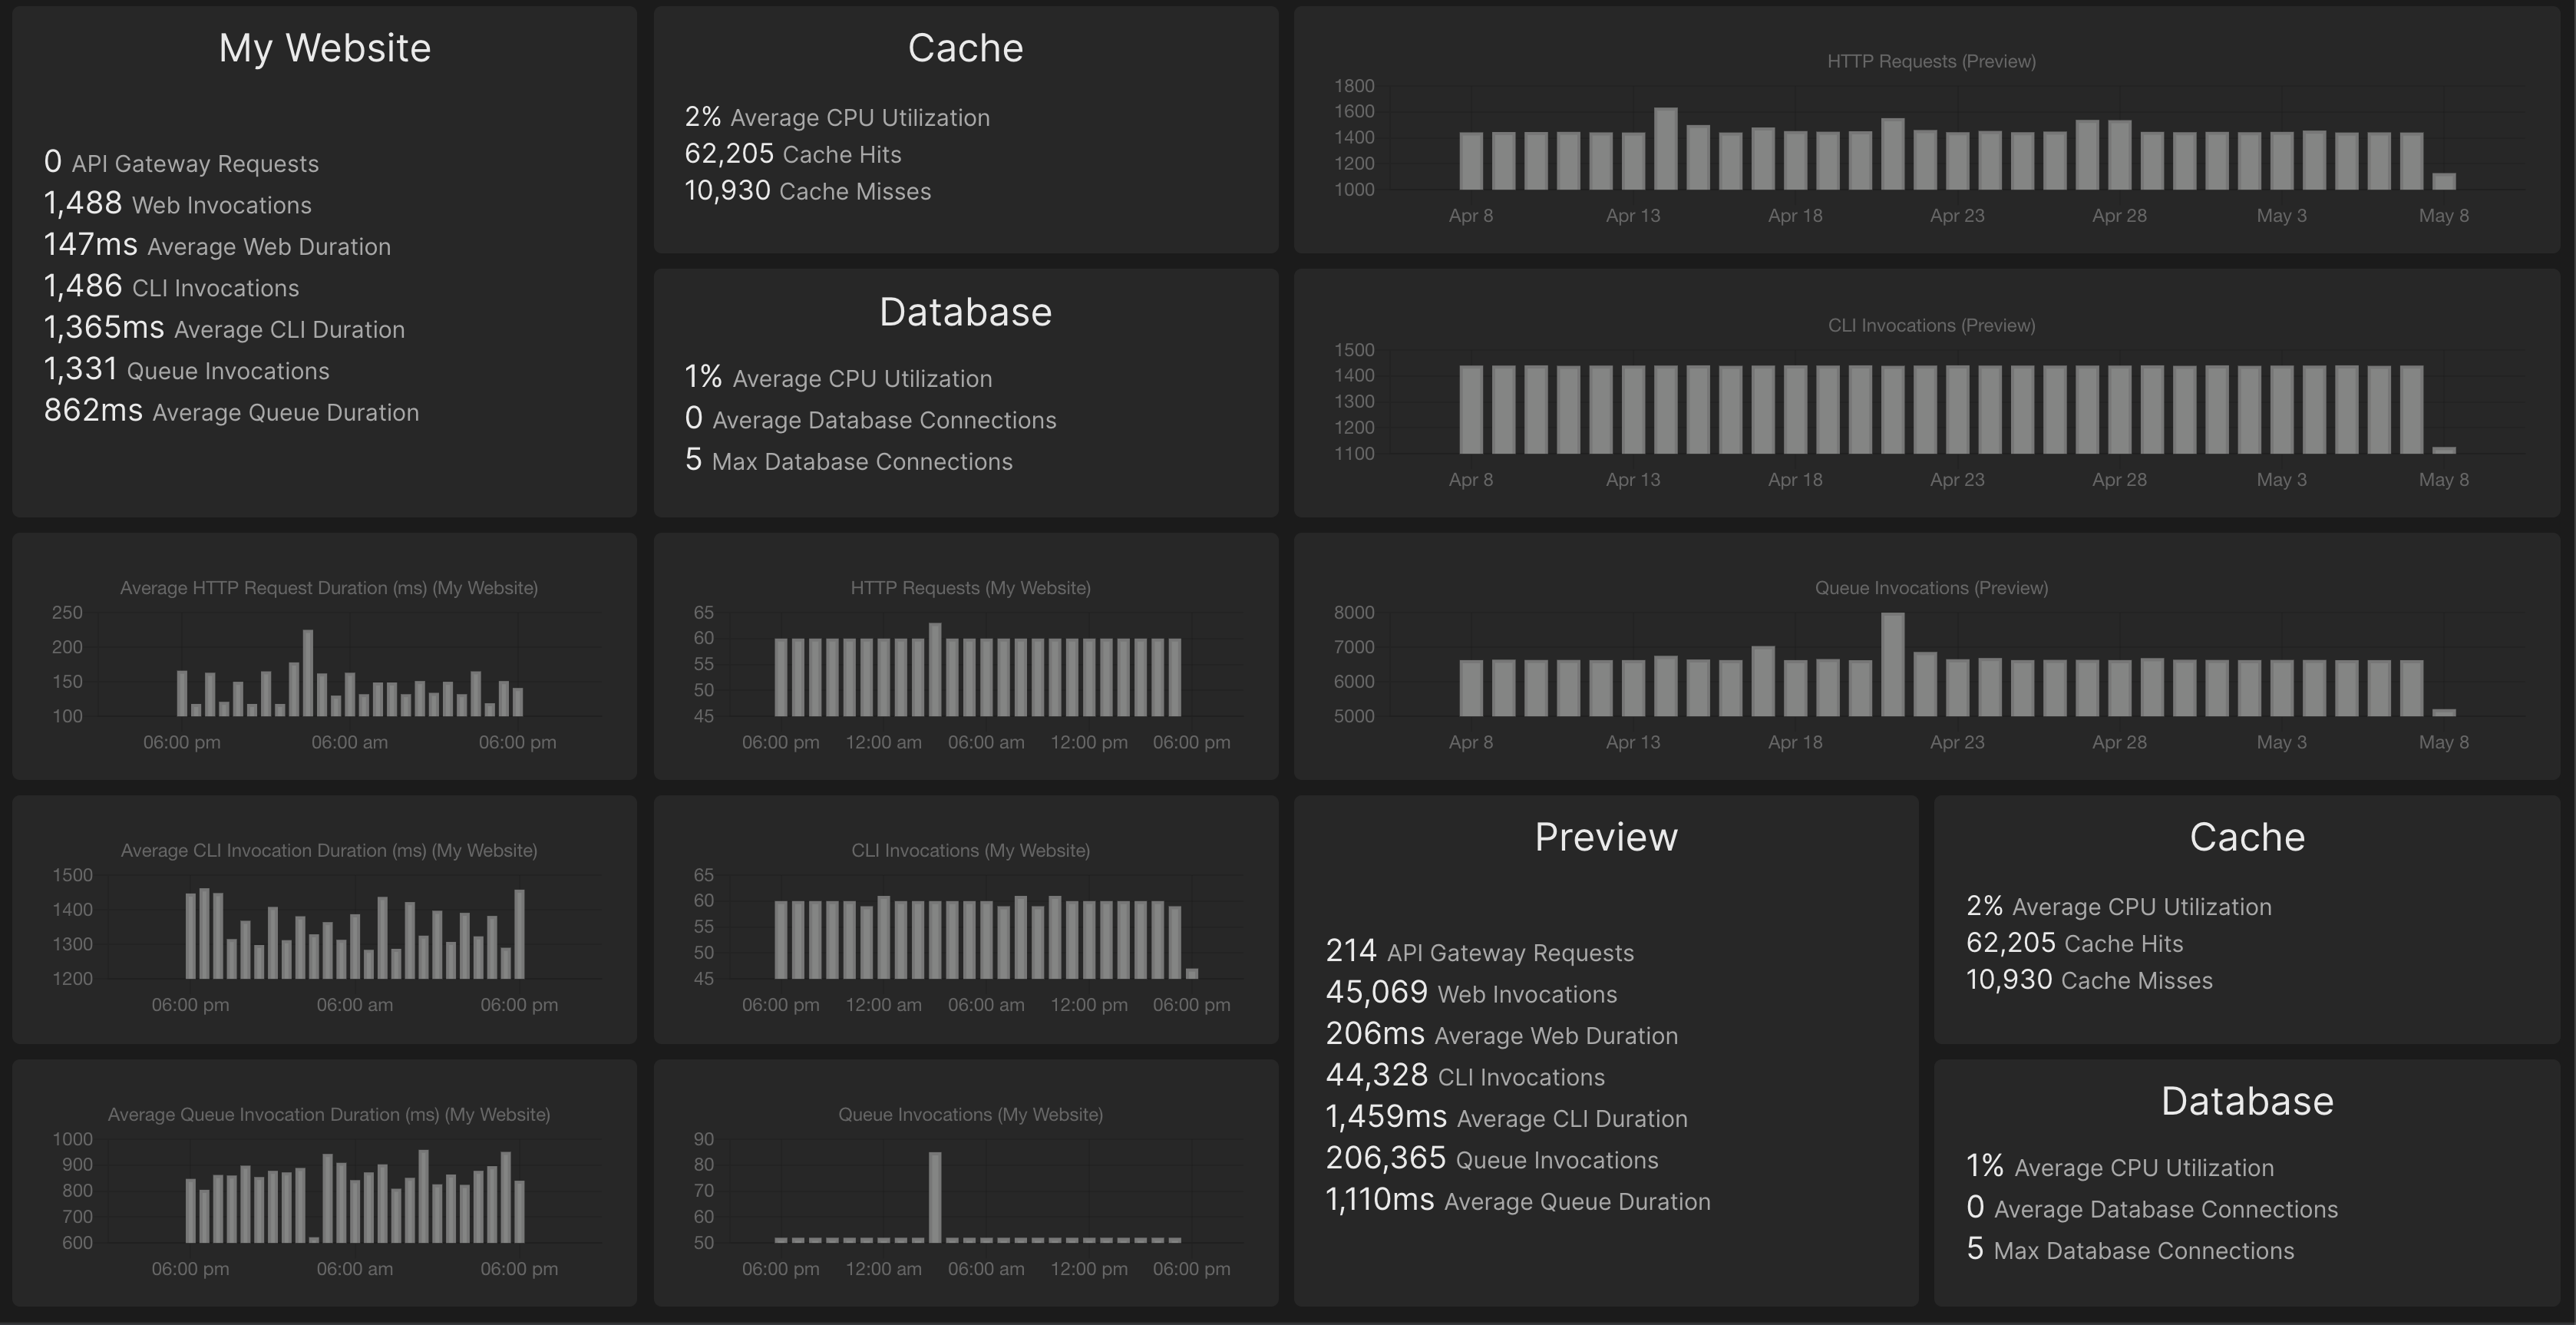
Displays metrics for all of your laravel vapor projects - caches, databases and environment metrics and charts included!
Installation
You can install the package via composer:
composer require fidum/laravel-dashboard-vapor-metrics-tile
Usage
In the dashboard config file, you must add this configuration in the tiles key. There are separate settings for
caches, databases and environments.
// in config/dashboard.php
return [
    // ...
    'tiles' => [
        'vapor_metrics' => [
            'secret' => env('VAPOR_API_TOKEN'), // optional: Uses `VAPOR_API_TOKEN` env by default
            'refresh_interval_in_seconds' => 300, // optional: Default: 300 seconds (5 minutes)
            'period' => '7d', // optional: 1m, 5m, 30m, 1h, 8h, 1d (default), 3d, 7d, 1M
            'caches' => [ // Leave empty if you don't want any cache tiles
                'My Cache Instance' => [ // Key will be used as the title of the displayed tile
                    'cache_id' => 222, // required: The id of your vapor cache instance
                    'period' => '7d', // optional: 1m, 5m, 30m, 1h, 8h, 1d (default), 3d, 7d, 1M
                    'refresh_interval_in_seconds' => 60, // optional: override individual tile
                    'secret' => null, // :optional: override individual tile
                ],
                'Another Cache' => ['cache_id' => 333]
            ],
            'databases' => [ // Leave empty if you don't want any database tiles
                'My Database' => [ // Key will be used as the title of the displayed tile
                    'database_id' => 555, // required: The id of your vapor database instance
                    'period' => '7d', // optional: 1m, 5m, 30m, 1h, 8h, 1d (default), 3d, 7d, 1M
                    'refresh_interval_in_seconds' => 60, // optional: override individual tile
                    'secret' => null, // :optional: override individual tile
                ],
                'Another Database' => ['database_id' => 444]
            ],
            'environments' => [ // Leave empty if you don't want any envrionment tiles
                'My Staging Website' => [ // Key will be used as the title of the displayed tile
                    'project_id' => 1111, // required: The id of your vapor project
                    'environment' => 'staging', // optional: Defaults to 'production'
                    'period' => '7d', // optional: 1m, 5m, 30m, 1h, 8h, 1d (default), 3d, 7d, 1M
                    'refresh_interval_in_seconds' => 60, // optional: override individual tile
                    'secret' => null, // :optional: override individual tile
                ],
                'My Production Website' => ['project_id' => 1111],
            ],
        ],
    ],
];
In app\Console\Kernel.php you should schedule the below to run every x minutes. Only add the commands where you have configured the related tiles above.
// in app/console/Kernel.php
protected function schedule(Schedule $schedule)
{
    $schedule->command(\Fidum\VaporMetricsTile\Commands\FetchVaporCacheMetricsCommand::class)->everyThirtyMinutes();
    $schedule->command(\Fidum\VaporMetricsTile\Commands\FetchVaporDatabaseMetricsCommand::class)->everyThirtyMinutes();
    $schedule->command(\Fidum\VaporMetricsTile\Commands\FetchVaporEnvironmentMetricsCommand::class)->everyThirtyMinutes();
}
In your dashboard view you can use one or all or multiple of each of these components. The tileName and position
attributes are required. The tileName attribute value needs to match the name specified in the config:
<x-dashboard>
    <livewire:vapor-environment-metrics-tile tileName="My Production Website" position="a1:a4" />
    <livewire:vapor-cache-metrics-tile tileName="My Cache Instance" position="b1:a2" />
    <livewire:vapor-database-metrics-tile tileName="My Database" position="b3:b4" />
    <livewire:vapor-environment-metrics-chart-tile type="http-requests-avg-duration" tileName="My Production Website" position="a5:a6" />
    <livewire:vapor-environment-metrics-chart-tile type="cli-avg-duration" tileName="My Production Website" position="a7:a8" />
    <livewire:vapor-environment-metrics-chart-tile type="queue-avg-duration" tileName="My Production Website" position="a9:a10" />
    <livewire:vapor-environment-metrics-chart-tile type="http-requests-total" tileName="My Production Website" position="b5:b6" />
    <livewire:vapor-environment-metrics-chart-tile type="cli-invocations-total" tileName="My Production Website" position="b7:b8" />
    <livewire:vapor-environment-metrics-chart-tile type="queue-invocations-total" tileName="My Production Website" position="b9:b10" />
</x-dashboard>
For charts an additional type value should be provided to select which chart to show:
cli-avg-duration: Average CLI Invocation Duration (ms)cli-invocations-total: CLI Invocationshttp-requests-avg-duration: Average HTTP Request Duration (ms)http-requests-total: HTTP Requestsqueue-avg-duration: Average Queue Invocation Duration (ms)queue-invocations-total: Queue Invocations
The charts use fidum/laravel-dashboard-chart-tile internally. You can use the below additional properties for further customisation:
heightsets the height of the chart, depending on your dashboard layout you may need to adjust this (defaults to100%).refreshIntervalInSecondsuse this to override the refresh rate of an individual tile (defaults to above configured setting)
Testing
composer test
Changelog
Please see CHANGELOG for more information on what has changed recently.
Contributing
Please see CONTRIBUTING for details.
Security
If you discover any security related issues, please email :author_email instead of using the issue tracker.
Credits
License
The MIT License (MIT). Please see License File for more information.

