ecocode / magento_profiler
Web Profiler for Magento 1.x
Package info
github.com/ecoco/magento_profiler
Type:magento-module
pkg:composer/ecocode/magento_profiler
Requires
- php: >=5.5.9
- jdorn/sql-formatter: ^1.2
- monolog/monolog: ^1.0
- symfony/debug: ^3.0|^4.0
- symfony/stopwatch: ^3.2|^4.0
- symfony/yaml: ^3.1|^4.0
Requires (Dev)
- magento-hackathon/magento-composer-installer: ^3.0|^4.0
- phpmd/phpmd: ^2.4
- phpunit/phpunit: ~4.0|~5.0
- satooshi/php-coveralls: ~1.0
This package is not auto-updated.
Last update: 2026-05-10 10:15:22 UTC
README
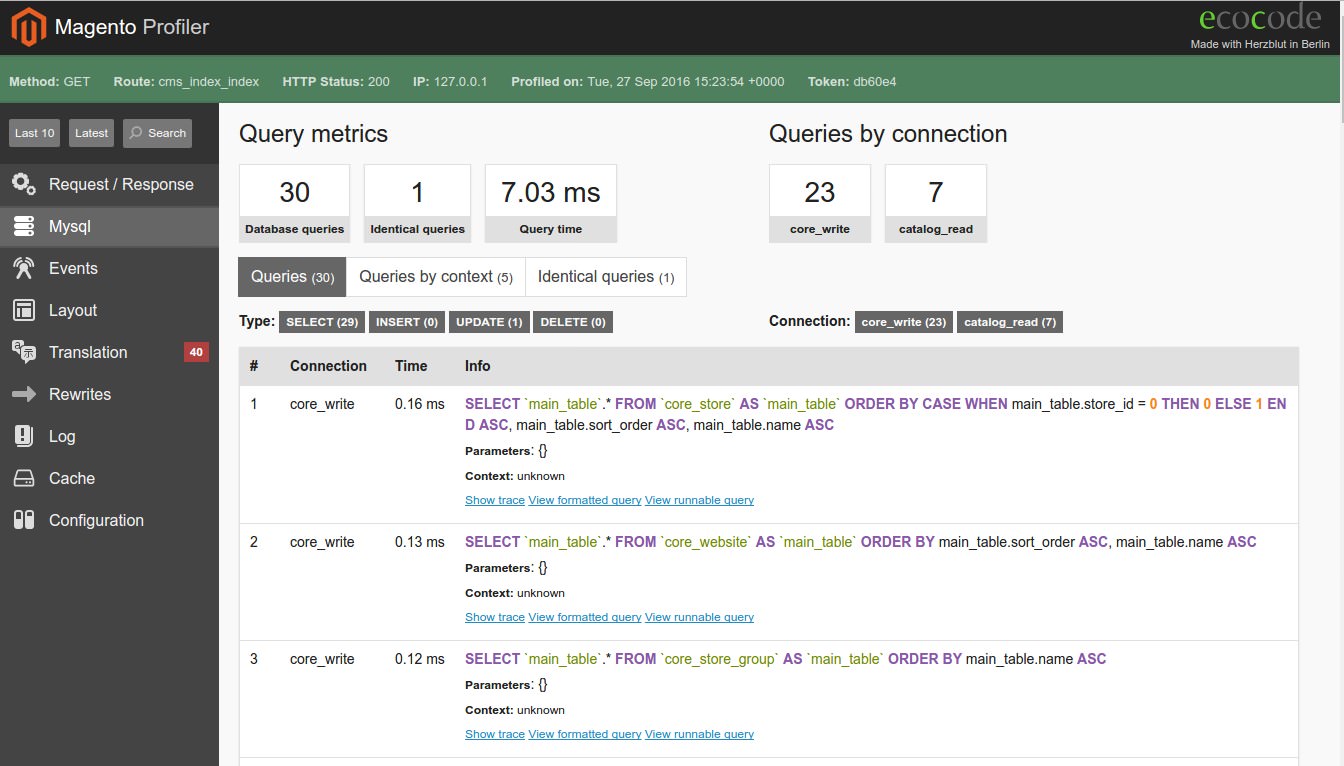
The ecocode profiler provides a development toolbar for Magento which displays a wide range of metrics and page load data for all the pages of the shop. It gives you direct access to the page's database queries, memory usage, events, requests, layout rendering, translation resolution and many other useful statistics. It is also easily extendable if you need to track additional metrics.
This profiler is based on the awesome Symfony WebProfiler. The concept and code of the WebProfiler have been ported to assist with Magento as much as possible.
Requirements
- php >= 5.5.9
- magento < 2
Tested with magento 1.7, 1.8. 1.9
Demo Stores:
Installation
Composer (recommended)
If you have not already configured magento-composer-installer add
"extra": {
   "magento-root-dir": "httpdocs/"
 }
to your composer.json. If your magento root dir is the same directory as the one containing your composer.json use "." as the magento-root-dir
composer require --dev ecocode/magento_profiler
Manually
Download the module and copy the app folder + "dev.php" into your magento root directory
If you install the module manually, it will miss some functionality until you install the dependencies. This is currently only possible via composer as we do need the composer autoloader.
To install the dependencies run the following from your magento root dir or a parent directory:
composer require --dev symfony/debug 3.0
composer require --dev symfony/stopwatch 3.2
composer require --dev symfony/yaml 3.1
composer require --dev jdorn/sql-formatter ~1.2
composer require --dev monolog/monolog 1.11
Magento Connect
Webserver Config
It might be necessary to extend your webserver config to handle "dev.php" correctly. If your experiencing a 404 when you try to access "dev.php"
Nginx:
try adding the following to your nginx config before the php location definition:
location /dev.php/ {
    rewrite / /dev.php;
}
Apache:
nothing to do here, should run out of the box
Usage
The profiler is only enabled if you open your shop via http://myshop.local/dev.php/.
The idea is to develop always in dev mode alias "dev.php" and only switch back to "production" from
time to time to verify the result.
Features
- Improved exception handling in dev mode with the symfony/debug. No more checking the log files!
- Easily extendable, just add a new collector via your configuration
Collectors
- Request/Response
- Display of request/response server parameters
- Memory
- Display of memory usage
- Time
- New visualization of the varien profiler
- Mysql
- Display of all queries with syntax highlighting and stack traces to locate the origin
- Queries by context so you can easily determine the origin block
- Detection of identical queries that can be avoided
- Metrics for "mysql crud" operations
- Support for multiple database connections
- Events
- Display of all events that have been fired during page load
- List of all called observers
- Ajax
- Recording of ajax calls
- Customer
- Display of customer group and tax class
- Layout
- Metrics including created and rendered blocks and total rendering time
- List of layout handlers used
- List of blocks created but not rendered
- Call graph including rendering times by block, including and excluding children
- Translations
- Display of translations that are defined, missing, invalid or are using a fallback
- Rewrites
- Detection of rewrites and rewrite conflicts (credits to magen98-magerun for the detection)
- Logs
- Display of all
Mage::logcalls
- Display of all
- Models
- Display of all model load, delete and save calls
- Detection of "load" calls within loops!
- Cache
- Display of current cache configuration including the option to enable/disable and flush from the profiler
- Display of all cache calls including not-for-cache hits and misses
- Configuration
- Base PHP configuration
- Option to view
phpinfo() - Basic magento configuration
- Display of enabled and disabled modules
Security
It is safe to add this module to your own vcs by default. The profiler is only active when you are visiting your page via "dev.php", which is restricted to request from localhost by default.
If you are using a vm you have to allow your host system to access the profiler. This can be done by modify the webserver config or the dev.php itself
Webserver: To allow the access to the profiler you have to set "$_SERVER['ALLOW_PROFILER'] = 1"
Nginx:
fastcgi_param ALLOW_PROFILER '1';
Apache:
SetEnv ALLOW_PROFILER "1"
Unlock special features
-
Open files in your editor
As symfony does, the profiler also widely supports "xdebug.file_link_format". If set up correctly it will allow you to click on most file references in the profiler to directly open it in your editor:
Example for PHP Storm
xdebug.file_link_format = "//localhost:63342/api/file/%f:%l"
Note: ommit the "protocol" in the link to make sure it will work on http and https without the need open a new tapIf you are using a virtual machine dont forget to also set "Host Magento Root Path" in the settings section. You can also set the "file_link_format" in the settings section directly.
TODO
- Improve docs
- "how to extend"
- capture emails
- performance tab
Mixed
If you get a gateway timeout 503 instead of an error message please try to adjust your
nginx config
http {
    ...
    fastcgi_buffers 8 16k;
    fastcgi_buffer_size 32k;
    ...
}
Need help?
Feel free to contact me jk@ecocode.de
Thanks to
- symfony/debug for the awesome debug component
- magen98-magerun for the rewrite conflict detection
- Symfony WebProfiler


