carlosafonso / plotta
A simple chart generation and manipulation library
Installs: 1
Dependents: 0
Suggesters: 0
Security: 0
Stars: 0
Watchers: 1
Forks: 0
Open Issues: 0
pkg:composer/carlosafonso/plotta
Requires
- php: >=7.3
This package is auto-updated.
Last update: 2026-02-08 17:19:24 UTC
README
A very simple PHP library to create static charts.
Install
Via Composer
$ composer require carlosafonso/plotta
Usage
$builder = new PlotBuilder();
$builder
    ->withDimensions(500, 250)
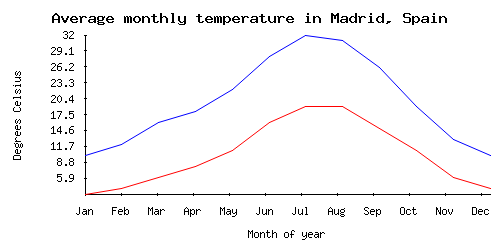
    ->withTitle('Average monthly temperature in Madrid, Spain')
    ->withXAxis(new XAxisConfig('Month of year', ['Jan', 'Feb', 'Mar', 'Apr', 'May', 'Jun', 'Jul', 'Aug', 'Sep', 'Oct', 'Nov', 'Dec']))
    ->withYAxis(new YAxisConfig('Degrees Celsius'))
    ->withData([10,12,16,18,22,28,32,31,26,19,13,10])
    ->withData([3,4,6,8,11,16,19,19,15,11,6,4])
    ->render('/path/to/chart.png');
This will produce a chart like the following one:
Security
If you discover any security related issues, please email the author instead of using the issue tracker.
Credits
License
The MIT License (MIT). Please see License File for more information.

