
beberlei / metrics

Simple library to talk to metrics collector services.
Requires
- php: >=8.4
- psr/log: ^3.0
Requires (Dev)
- aws/aws-sdk-php: ^3.339
- doctrine/dbal: ^3.9 || ^4.0
- influxdata/influxdb-client-php: ^3.9
- influxdb/influxdb-php: ^1.15
- open-telemetry/api: ^1.1
- open-telemetry/sdk: ^1.2.4
- phpunit/phpunit: ^13
- promphp/prometheus_client_php: ^2.10
- symfony/framework-bundle: ^6.4 || ^7.4 || ^8.0
Suggests
- aws/aws-sdk-php: For CloudWatch integration
- doctrine/dbal: For Doctrine DBAL integration
- influxdata/influxdb-client-php: For InfluxDB (v2+) integration
- influxdb/influxdb-php: For InfluxDB (v1) integration
- open-telemetry/api: For OpenTelemetry integration
- promphp/prometheus_client_php: For Prometheus integration
- symfony/framework-bundle: For Symfony integration
Provides
None
Conflicts
- symfony/framework-bundle: <6.4
Replaces
None
README
Simple library that abstracts different metrics collectors. I find this necessary to have a consistent and simple metrics API that doesn't cause vendor lock-in.
It also ships with a Symfony Bundle. This is not a library for displaying metrics.
Important
Upgrading from 2.x? Read the UPGRADE guide first: it documents every breaking change and how to migrate your code.
A full demo application is available, with a Docker stack provisioning Grafana dashboards for every collector:
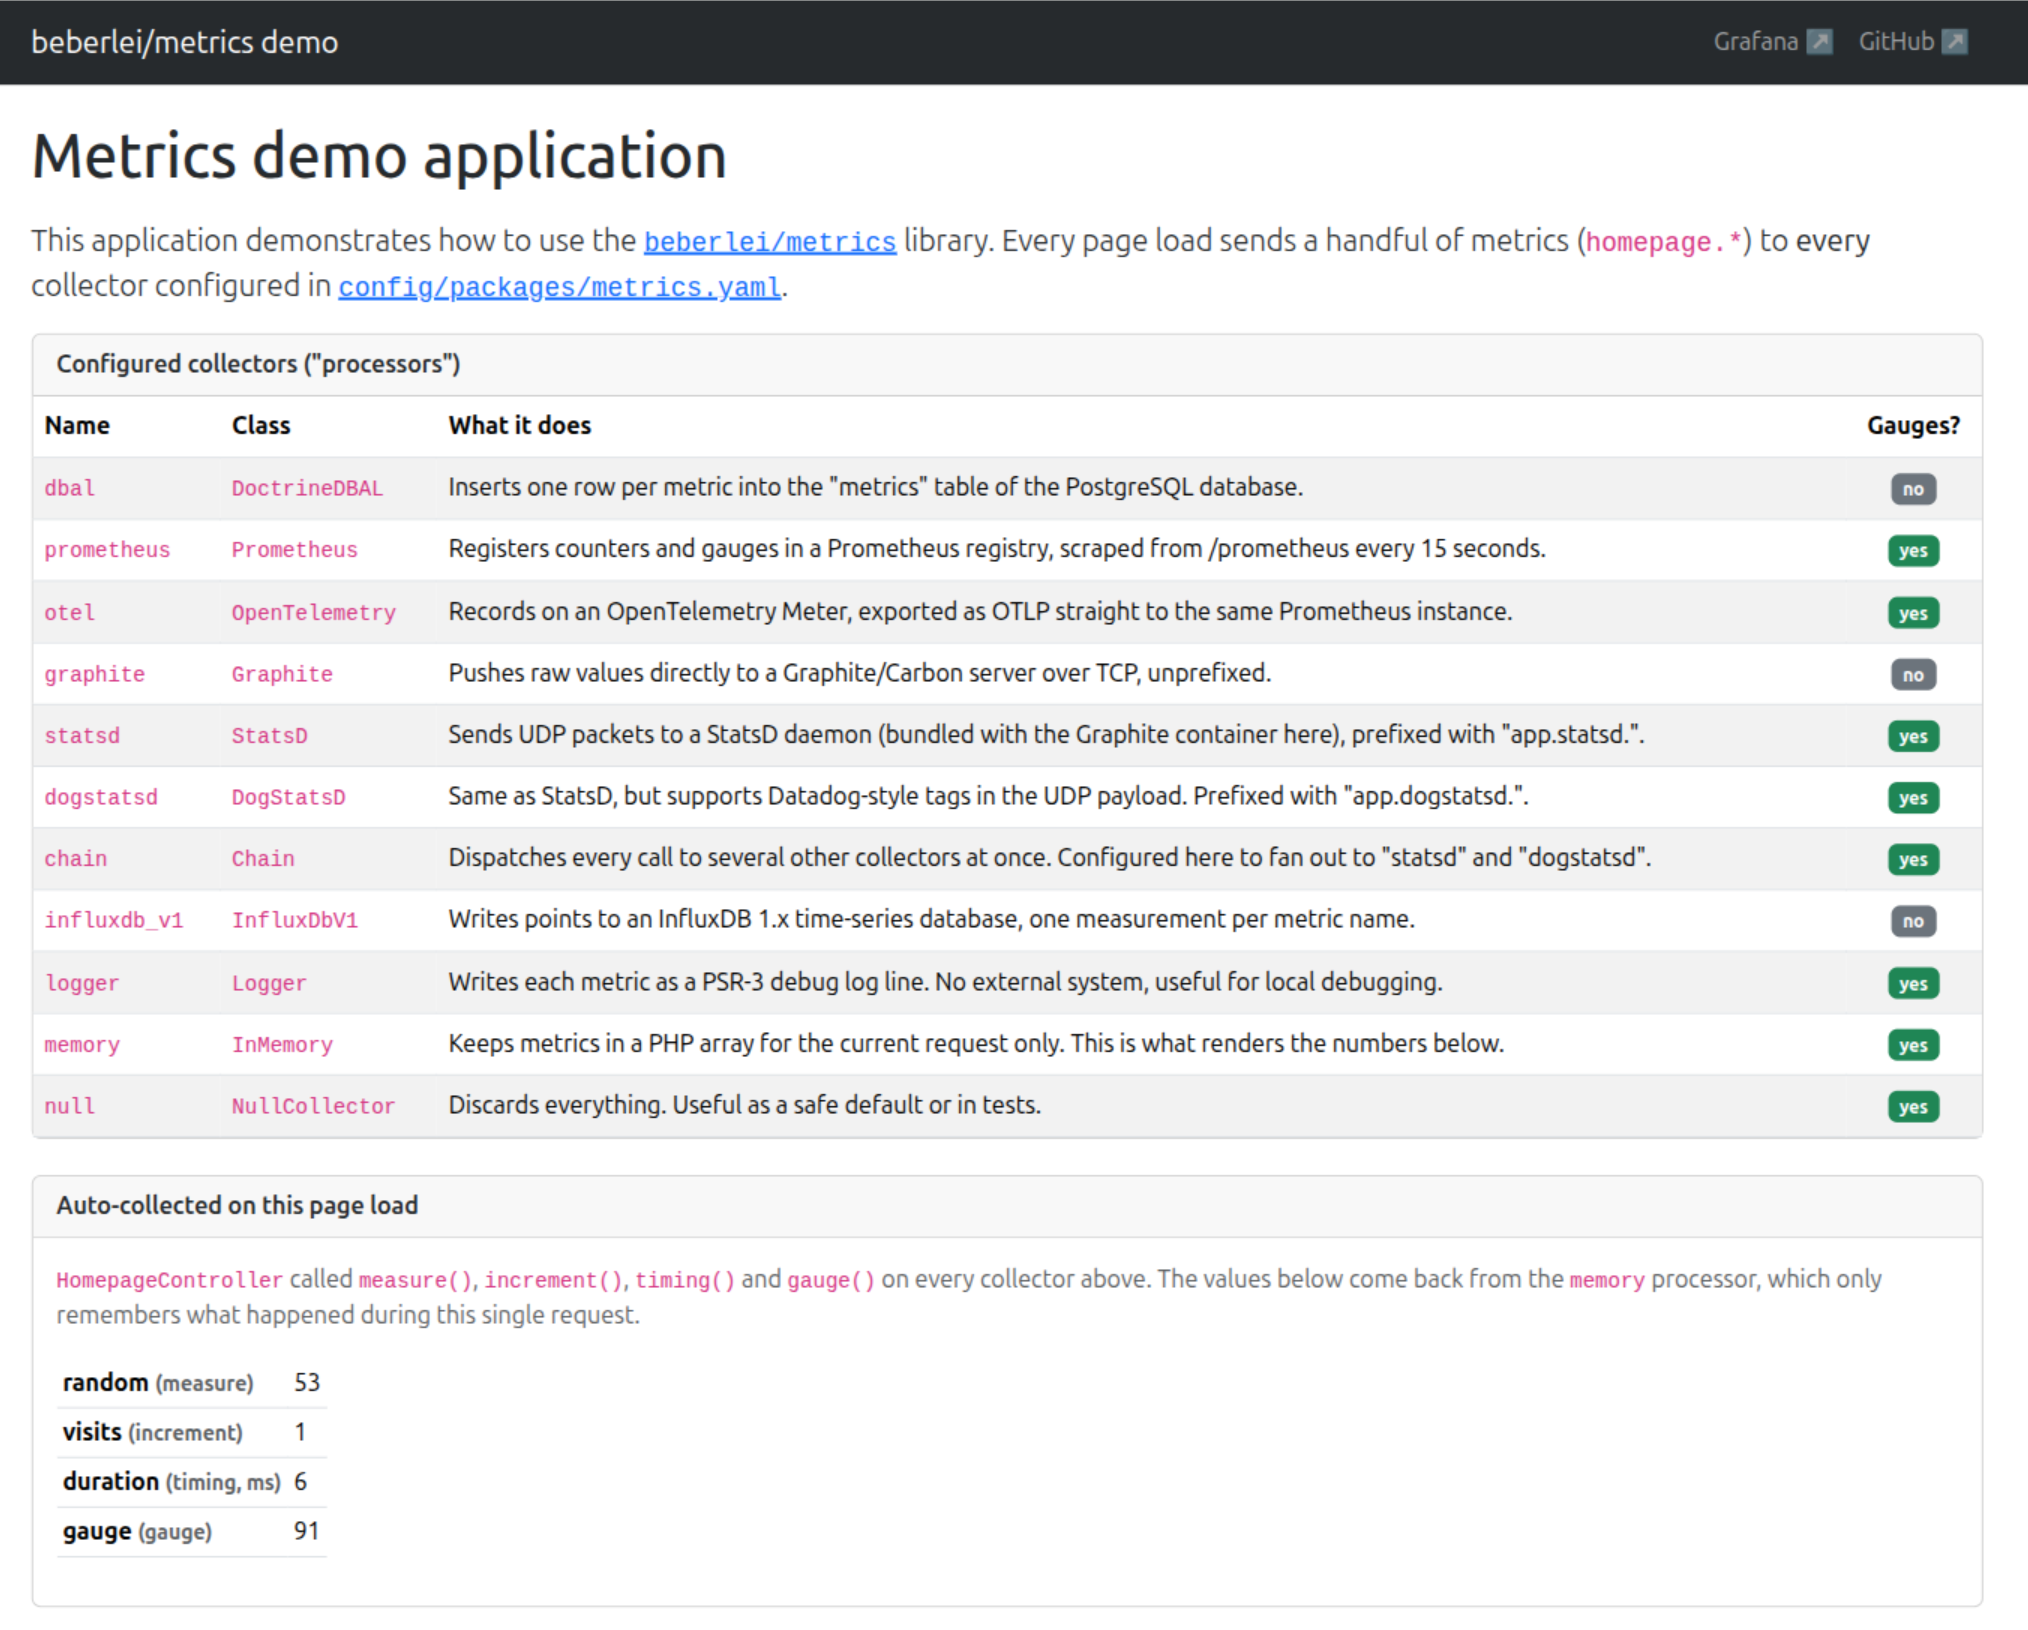
Currently supported backends:
- Chain (Dispatches to a list of other collectors)
- CloudWatch
- Doctrine DBAL
- DogStatsD
- Graphite
- InfluxDb (version 1)
- InfluxDb (version 2+)
- Logger (Psr\Log\LoggerInterface)
- Null (Dummy that does nothing)
- OpenTelemetry
- Prometheus
- StatsD
- Telegraf
Installation
Using Composer:
composer require beberlei/metrics
API
You can instantiate clients:
$collector = \Beberlei\Metrics\Factory::create('statsd');
You can measure stats:
$collector->increment('foo.bar');
$collector->decrement('foo.bar');

$start = hrtime(true);
$milliseconds = (hrtime(true) - $start) / 1_000_000;
$collector->timing('foo.bar', $milliseconds);

$value = 1234;
$collector->measure('foo.bar', $value);
Timings are expressed in milliseconds and accept integers or floats.
All backends defer sending and aggregate all information, make sure to call flush:
$collector->flush();
Sending metrics to several backends at once
The Chain collector dispatches every call to a list of other collectors. It
is useful when you want to send the same metrics to several backends, for
example StatsD and a logger:
$collector = new \Beberlei\Metrics\Collector\Chain(
    \Beberlei\Metrics\Factory::create('statsd'),
    \Beberlei\Metrics\Factory::create('logger', ['logger' => $logger]),
);

$collector->increment('foo.bar');
$collector->flush();
It also implements GaugeableCollectorInterface: gauge() calls are only
forwarded to the chained collectors that support gauges, the others are
silently skipped.
Sending Influx StatsD tags through Telegraf
The transport remains StatsD over UDP. The Telegraf collector emits the
advanced Influx StatsD dialect, metric,key=value:value|type, for receivers
such as Telegraf. Constructor tags are defaults for every measurement;
per-call tags are merged over them. Names and values are URL-encoded using
RFC 3986.
$collector = new \Beberlei\Metrics\Collector\Telegraf(
    tags: ['environment' => 'production'],
);

$collector->timing('http.request_duration', 12.345, [
    'path' => 'player/home fr',
    'status' => 200,
    'method' => 'GET',
]);
This emits:
http.request_duration,environment=production,path=player%2Fhome%20fr,status=200,method=GET:12.345|ms
Sending metrics through OpenTelemetry
The OpenTelemetry collector records measurements on an
OpenTelemetry MeterProvider.
It requires the open-telemetry/api package, and an actual SDK (such as
open-telemetry/sdk together with an exporter) to do anything useful with the
recorded data:
composer require open-telemetry/api open-telemetry/sdk open-telemetry/exporter-otlp
$collector = new \Beberlei\Metrics\Collector\OpenTelemetry(
    $meterProvider, // an OpenTelemetry\API\Metrics\MeterProviderInterface
    'my_app', // instrumentation scope name, defaults to "beberlei/metrics"
    ['dc' => 'west'], // default attributes merged into every data point
);

$collector->increment('foo.bar');
$collector->flush();
It can also be created through the Factory:
$collector = \Beberlei\Metrics\Factory::create('opentelemetry', [
    'meter_provider' => $meterProvider,
    'name' => 'my_app', // optional, defaults to "beberlei/metrics"
    'tags' => ['dc' => 'west'], // optional
]);
Calls are recorded immediately on the underlying OpenTelemetry instruments,
as the API is meant to be used, instead of being buffered like the other
collectors. flush() only calls forceFlush() on the MeterProvider, so
that anything still buffered by the SDK's own exporters is sent before a
short-lived PHP process ends; it is a no-op if the provider does not support
it (for example the API's NoopMeterProvider).
Like every other collector, it never lets an error or exception raised by the underlying provider/instruments (or by a non-stringable tag value) reach the instrumented application: those calls are silently ignored.
Each method maps to the OpenTelemetry instrument that matches its semantics the closest:
measure()/increment()/decrement()use anUpDownCounter, since aCounteris monotonic and cannot go down or receive a negative amounttiming()uses aHistogram, with amsunitgauge()uses aGauge, tracking relative+/-adjustments locally before recording the resulting absolute value, like the other collectors
Sending metrics to InfluxDB (version 2+)
The InfluxDbV2 collector writes points to an
InfluxDB 2.x/3.x bucket through the official
influxdata/influxdb-client-php client. It requires an InfluxDB2\WriteApi,
created from an InfluxDB2\Client:
composer require influxdata/influxdb-client-php
$client = new \InfluxDB2\Client([
    'url' => 'http://localhost:8086',
    'token' => 'my-token',
    'org' => 'my-org',
    'bucket' => 'my-bucket',
]);

$collector = new \Beberlei\Metrics\Collector\InfluxDbV2(
    $client->createWriteApi(),
    ['dc' => 'west'], // default tags merged into every point
);

$collector->increment('foo.bar');
$collector->flush();
It can also be created through the Factory:
$collector = \Beberlei\Metrics\Factory::create('influxdb_v2', [
    'write_api' => $client->createWriteApi(),
    'tags' => ['dc' => 'west'], // optional
]);
Every metric is written as one field, named value, on a point whose
measurement is the metric name. InfluxDB 3.x servers accept the same v2
write API in compatibility mode, so this collector works against both.
Sending metrics to AWS CloudWatch
The CloudWatch collector publishes metric data points through
Amazon CloudWatch's PutMetricData API,
using the official AWS SDK for PHP. It requires an Aws\CloudWatch\CloudWatchClient:
composer require aws/aws-sdk-php
$client = new \Aws\CloudWatch\CloudWatchClient([
    'region' => 'us-east-1',
    'version' => 'latest',
]);

$collector = new \Beberlei\Metrics\Collector\CloudWatch(
    $client,
    'my_app', // CloudWatch namespace, defaults to "beberlei/metrics"
    ['dc' => 'west'], // default tags, turned into CloudWatch dimensions
);

$collector->increment('foo.bar');
$collector->flush();
It can also be created through the Factory:
$collector = \Beberlei\Metrics\Factory::create('cloudwatch', [
    'client' => $client,
    'namespace' => 'my_app', // optional, defaults to "beberlei/metrics"
    'tags' => ['dc' => 'west'], // optional
]);
Credentials and region are resolved by the AWS SDK itself (environment
variables, an IAM role, a shared config file, an explicit credentials
option on the client, ...), the collector does not handle them. measure()
and increment()/decrement() use the Count unit, timing() uses
Milliseconds.
Symfony Bundle Integration
Register Bundle in bundles.php
// config/bundles.php

return [
    // ...
    Beberlei\Bundle\MetricsBundle\BeberleiMetricsBundle::class => ['all' => true],
];
Do some configuration:
# app/config/config.yml
beberlei_metrics:
    default: statsd
    collectors:
        influxdb:
            type: influxdb_v1
            database: metrics
            # host: localhost # option
            # username: username # optional
            # password: password # optional
            # port: 8086 # optional
            # If you want to use a custom database service
            # It must be an instance of "InfluxDB\Database"
            # In this case, you can omit de "database" option
            # service: my.service.id
            tags: # optional
                dc: "west"
                node_instance: "hermes10"
        influxdb2:
            type: influxdb_v2
            token: my-token
            org: my-org
            bucket: metrics
            # host: localhost # default
            # port: 8086 # default
            # protocol: http # default
            # If you want to use a custom write API service
            # It must be an instance of "InfluxDB2\WriteApi"
            # In this case, you can omit the "token"/"org"/"bucket" options
            # service: my.service.id
            tags: # optional
                dc: "west"
                node_instance: "hermes10"
        cloudwatch:
            type: cloudwatch
            region: us-east-1
            namespace: app_name # optional, defaults to "beberlei/metrics"
            # If you want to use a custom client service
            # It must be an instance of "Aws\CloudWatch\CloudWatchClient"
            # In this case, you can omit the "region" option
            # service: my.service.id
            tags: # optional
                dc: "west"
                node_instance: "hermes10"
        otel:
            type: opentelemetry
            # The service must be an instance of
            # "OpenTelemetry\API\Metrics\MeterProviderInterface"
            service: my.meter_provider.service.id
            namespace: app_name # optional, instrumentation scope name, defaults to "beberlei/metrics"
            tags: # optional
                dc: "west"
                node_instance: "hermes10"
        prometheus:
            type: prometheus
            # If you want to use a custom registry service
            # It must be an instance of "Prometheus\CollectorRegistry"
            # By default it uses an "Prometheus\Storage\InMemory" adapter
            # service: my.service.id
            namespace: app_name # optional
            tags: # optional
                dc: "west"
                node_instance: "hermes10"
        statsd:
            type: statsd
            # host: localhost # default
            # port: 8125 # default
            # prefix: '' # default
        dogstatsd:
            type: dogstatsd
            # host: localhost # default
            # port: 8125 # default
            # prefix: '' # default
        telegraf:
            type: telegraf
            # Influx StatsD over UDP, suitable for Telegraf receivers
            # host: localhost # default
            # port: 8125 # default
            # prefix: '' # default
            tags: # optional defaults, overridden by per-call tags
                environment: production
        dbal:
            type: doctrine_dbal
            # Use another connection, by default it uses the default connection
            # connection: metrics
        monolog:
            type: logger
        both:
            type: chain
            # The names of the collectors to dispatch every call to
            collectors: [statsd, monolog]
Then, you can inject the Beberlei\Metrics\Collector\CollectorInterface and
start using it:
use Beberlei\Metrics\Collector\CollectorInterface;

final readonly class MyService
{

    public function __construct(
        private CollectorInterface $collector,
    ) {
    }

    public function doSomething(): void
    {
        $this->collector->increment('foo.bar');
    }
}
The Beberlei\Metrics\Collector\CollectorInterface is automatically aliased to
the default collector.
If you want to inject a specific collector, you must use the #[Target] attribute:
public function __construct(
    #[Target('name_of_the_collector')]
    CollectorInterface $memoryCollector,
) {