petrica / statsd-gearman
statsd gearman metrics collector in PHP
Requires
- brianlmoon/net_gearman: dev-master
- petrica/statsd-system: dev-master
Requires (Dev)
- phpunit/phpunit: >= 4.8.0
This package is not auto-updated.
Last update: 2026-04-23 08:07:23 UTC
README
Gearman metrics collector for statsd written in PHP.
Install using composer:
composer require petrica/statsd-gearman
Requirements:
- PHP ^5.5
Run with:
vendor/bin/statsd-console statsd:notify --verbose gauges.yml
Please have a look at the main statsd library here.
Sample config file:
The configuration file is pretty straightforward, you specify the gauge class name and class arguments
gauges:
    gearman:
        class: Petrica\StatsdGearman\Gauge\GearmanGauge
        arguments:
            server: localhost:4730
            timeout: 1
Where we have the following parameters:
server - Gearman server host and port
server: [host]:[port]
timeout - Connection timeout in seconds
timeout: [seconds]
Graphite
Having statsd integrated with graphite, you will find gearman metrics under:
stats.gauges.system.gearman.[job_name].queue - number of jobs in queue
stats.gauges.system.gearman.[job_name].running - number of running workers
stats.gauges.system.gearman.[job_name].workers - number of available workers
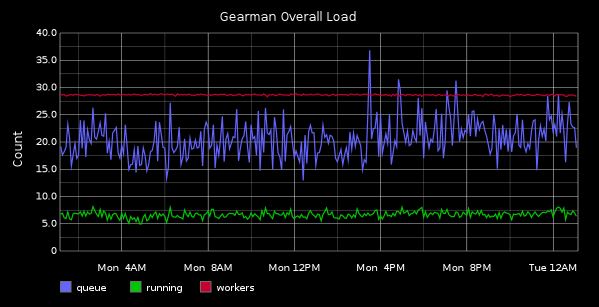
Here is an example of how a graph might look like for all stats aggregated:
In this example we have 27 available workers, around 20 jobs in queue and around 7 active workers every 5 minutes. Of course this example doesn't tell much about gearman load, but tracking each job individually will get you enough information to know if you need to span additional workers in order to keep up with the flow of jobs.
Here is the graph URL:
/render?width=600&from=-24hours&until=now&height=300&target=aliasByNode(summarize(sumSeries(stats.gauges.system.gearman.*.queue)%2C%20%225minutes%22%2C%20%22avg%22%2C%20true)%2C5)&target=aliasByNode(summarize(sumSeries(stats.gauges.system.gearman.*.running)%2C%20%225minutes%22%2C%20%22avg%22%2C%20true)%2C5)&target=aliasByNode(summarize(sumSeries(stats.gauges.system.gearman.*.workers)%2C%20%225minutes%22%2C%20%22avg%22%2C%20true)%2C5)&title=Gearman%20Overall%20Load&vtitle=Count&_uniq=0.5637446563409128

