noki / laravel-php-graph
PHP Graphing Library that creates graphs in Laravel
Installs: 2
Dependents: 0
Suggesters: 0
Security: 0
Stars: 0
Watchers: 0
Forks: 0
Open Issues: 0
pkg:composer/noki/laravel-php-graph
Requires
- php: ^7.0 || ^8.0
- ext-gd: *
This package is auto-updated.
Last update: 2026-01-07 14:17:47 UTC
README
📜 History of PHP Graph Lib
The first version of PHP Graph Lib was created by Elliott Brueggeman in late 2007 🙂 — almost 20 years ago! Good things really do stand the test of time.
You can thank Elliott Brueggeman by giving stars to his repositories or following him. Remember, he created this library under the MIT License and made it freely available. Today, it remains one of the best PHP libraries for creating graphs and pie charts under the MIT License.
Since 2007 and the first version of this library PHP versions have changed and so the library evolved. Current version is compatible with PHP 8.2.
Current repo is forked from repository of Troopster19 and at the moment of forking code was under MIT licence.
❓ What does this package do?
This package allows you to create graph and pie chart images. You have several options for handling images, including:
- Displaying image from php memory
- Save image to storage in Laravel and later handle that image
- Save image to public directory in Laravel. This way you have public access to this image. This package provides URL for public images.
Warning
Why Check Out This Package
- Few Laravel packages provide both graph and chart generation plus image export support.
- It’s lightweight, easy to integrate, and released under the MIT license for full flexibility.
🚀 Installation
Requirements
- PHP >= 8.0
- Laravel >= 9
- PHP Extensions:
- GD library (
ext-gd)
- GD library (
Composer Installation
composer require noki/laravel-php-graph
⚙️ PHP GD Extension Setup
Linux (Debian/Ubuntu)
sudo apt-get update
sudo apt-get install php-gd
Example for PHP 8.3 — be sure to use the correct package names:
First, check your PHP version:
php -v
Then install GD for your version:
sudo apt-get install php8.3-gd
To verify if GD is installed:
php -m | grep gd
macOS (with Homebrew)
brew install php
# OR, if PHP is already installed:
brew reinstall php
The GD extension (
gd) is bundled with PHP on macOS. No extra installation is usually required.
To confirm GD is enabled:
php -m | grep gd
Windows
- Open your
php.inifile. - Ensure the following line is uncommented (remove the
;at the beginning):
extension=gd
- Restart your web server (Apache, Nginx) or PHP-FPM.
Verify installation
Run the following command to check if GD is enabled:
php -m | findstr gd
📦 Usage
Namespace
use Noki\PhpGraph\Graph;
1. Create a private graph (not publicly accessible)
        $data = array(
            12124,
            5535,
            43373,
            22223,
            90432,
            23332,
            15544,
            24523,
            32778,
            38878,
            28787,
            33243,
            34832,
            32302
        );

        $graph = new Graph(500, 350);

        $graph->setTitle('Widgets Produced');
        $graph->setGradient('red', 'maroon');
        $graph->addData($data);
        $file_path = $graph->createGraph('my_file_name' ,'F');
With line
$file_path = $graph->createGraph('my_file_name' ,'F');
it is set file name without extension or directory root. Parameter 'F' is used for output to file. This file will be saved in storage/app/private/php-graph-data directory inside Laravel.
File will be saved at that route and in variable $file_path will be set route to graph image.
Important notes:
- Only ASCII codes are allowed in texts in PHP Graph Lib.
- Since the output image format is always PNG, you do not need to set a file extension — any extension you provide will be ignored and
.pngwill be automatically added.Also, if you include a directory path in the file name, it will be removed, because all images are saved in the
storage/app/private/php-graph-datadirectory.
2. Create a public graph (publicly accessible)
Use same code as above for graph drawing just change last line
$file_url = $graph->createGraph('my_file_name' ,'U');
This way image will be saved to public/images/php-graph-data/ directory. This image will be publicly accessible. In variable $file_url will be returned URL to this image.
Important note:
- Only ASCII codes are allowed in texts in PHP Graph Lib.
- Since the output image format is always PNG, you do not need to set a file extension — any extension you provide will be ignored and
.pngwill be automatically added.Also, if you include a directory path in the file name, it will be removed, because all images are saved in the
public/images/php-graph-datadirectory.
3. Save image in PHP memory and display it without save to server
This is example of creating image from Controller.
- Create route in
routes/web.php
Route::get('/testing', [TestController::class, 'testing']);
- Create controller in
app/Http/TestController.php
<?php

namespace App\Http\Controllers;

use Noki\PhpGraph\Graph;

class TestController extends Controller
{
    public function testing()
    {
        $data = array(
            12124,
            5535,
            43373,
            22223,
            90432,
            23332,
            15544,
            24523,
            32778,
            38878,
            28787,
            33243,
            34832,
            32302
        );

        $graph = new Graph(500, 350);

        $graph->setTitle('Widgets Produced');
        $graph->setGradient('red', 'maroon');
        $graph->addData($data);
        $image_content = $graph->createGraph();

        return response($image_content)->header('Content-Type', 'image/png');

    }

}
Summary of options
- Save to file for internal use:
$graph->createGraph('my_file_name' ,'F');
- Save to file and file can be publicly accessed:
$graph->createGraph('my_file_name' ,'U');
- Save to memory
$graph->createGraph();
🧪 Examples
Example 1 - Graph
<?php

    use Noki\PhpGraph\Graph;

	$data = array(
		12124,
		5535,
		43373,
		22223,
		90432,
		23332,
		15544,
		24523,
		32778,
		38878,
		28787,
		33243,
		34832,
		32302
	);

	$graph = new Graph(500, 350);

	$graph->setTitle('Widgets Produced');
	$graph->setGradient('red', 'maroon');

	$graph->addData($data);

    $file_path = $graph->createGraph('example1', 'F');
Creates graph:
Example 2 - Graph
<?php

    use Noki\PhpGraph\Graph;

	$data = array(
		"Jan" => -1324,
		"Feb" => -1200,
		"Mar" => -100,
		"Apr" => -1925,
		"May" => -1444,
		"Jun" => -957,
		"Jul" => -364,
		"Aug" => -221,
		"Sep" => -1300,
		"Oct" => -848,
		"Nov" => -719,
		"Dec" => -114
	);

	$graph = new Graph(500, 450);

	$graph->setBarColor('255, 255, 204');
	$graph->setTitle('Money Made at XYZ Corp');
	$graph->setTextColor('gray');

	$graph->addData($data);

    $url = $graph->createGraph('example2', 'U');
Creates graph:
Example 3 - Graph
<?php

    use Noki\PhpGraph\Graph;

	$data = array(
		"Roger" => 145,
		"Ralph" => 102,
		"Rhonda" => 123,
		"Ronaldo" => 137,
		"Rosario" => 149,
		"Robin" => 99,
		"Robert" => 88,
		"Rustof" => 111
	);

	$graph = new Graph(350, 280);

	$graph->setBackgroundColor("black");
	$graph->setBarColor('255, 255, 204');
	$graph->setTitle('IQ Scores');
	$graph->setTitleColor('yellow');
	$graph->setupYAxis(12, 'yellow');
	$graph->setupXAxis(20, 'yellow');
	$graph->setGrid(false);
	$graph->setGradient('silver', 'gray');
	$graph->setBarOutlineColor('white');
	$graph->setTextColor('white');
	$graph->setDataPoints(true);
	$graph->setDataPointColor('yellow');
	$graph->setLine(true);
	$graph->setLineColor('yellow');

	$graph->addData($data);

    $graph->createGraph();
Creates graph:
Example 4 - Graph
<?php

    use Noki\PhpGraph\Graph;

	$data = array(
		"Alpha" => 1145,
		"Beta" => 1202,
		"Cappa" => 1523,
		"Delta" => 1437,
		"Echo" => 949,
		"Falcon" => 999,
		"Gamma" => 1188
	);

	$data2 = array(
		"Alpha" => 898,
		"Beta" => 1498,
		"Cappa" => 1343,
		"Delta" => 1345,
		"Echo" => 1045,
		"Falcon" => 1343,
		"Gamma" => 987
	);

	$graph = new Graph(520, 280);

	$graph->setBarColor('blue', 'green');
	$graph->setTitle('Company Production');
	$graph->setupYAxis(12, 'blue');
	$graph->setupXAxis(20);
	$graph->setGrid(false);
	$graph->setLegend(true);
	$graph->setTitleLocation('left');
	$graph->setTitleColor('blue');
	$graph->setLegendOutlineColor('white');
    $graph->setLegendColor('orange');
	$graph->setLegendTitle('Week-37', 'Week-38');
	$graph->setXValuesHorizontal(true);

	$graph->addData($data, $data2);

    $file_path = $graph->createGraph('example4', 'F');
Creates graph:
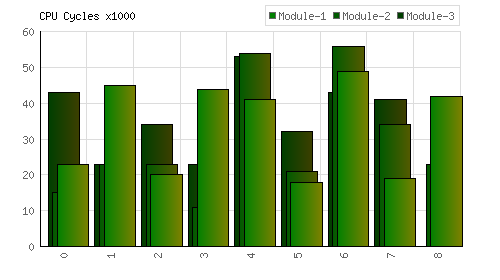
Example 5 - Graph
<?php

    use Noki\PhpGraph\Graph;

	$graph = new Graph(500, 280);

	$data = array(23, 45, 20, 44, 41, 18, 49, 19, 42);
	$data2 = array(15, 23, 23, 11, 54, 21, 56, 34, 23);
	$data3 = array(43, 23, 34, 23, 53, 32, 43, 41);

	$graph->setTitle('CPU Cycles x1000');
	$graph->setTitleLocation('left');
	$graph->setLegend(true);
	$graph->setLegendTitle('Module-1', 'Module-2', 'Module-3');
	$graph->setGradient('green', 'olive');

	$graph->addData($data, $data2, $data3);

    $url = $graph->createGraph('example5', 'U');
Creates graph:
Example 6 - Graph
<?php

    use Noki\PhpGraph\Graph;

	$data = array(
		"Jan" => -10.1,
		"Feb" => -3.6,
		"Mar" => 11.0,
		"Apr" => 30.7,
		"May" => 48.6,
		"Jun" => 59.8,
		"Jul" => 62.5,
		"Aug" => 56.8,
		"Sep" => 45.5,
		"Oct" => 25.1,
		"Nov" => 2.7,
		"Dec" => -6.5
	);

	$graph = new Graph(450, 300);

	$graph->setBarColor('navy');
	$graph->setupXAxis(20, 'blue');
	$graph->setTitle('Average Temperature by Month, in Fairbanks Alaska');
	$graph->setTitleColor('blue');
	$graph->setGridColor('153, 204, 255');
	$graph->setDataValues(true);
	$graph->setDataValueColor('navy');
	$graph->setDataFormat('degrees');
	$graph->setGoalLine('32', 'fuscia', 'dashed');

	$graph->addData($data);

	$graph->createGraph();
Creates graph:
Example 7 - Graph
<?php

    use Noki\PhpGraph\Graph;

	$data = array(
		"1" => .0032,
		"2" => .0028,
		"3" => .0021,
		"4" => .0033,
		"5" => .0034,
		"6" => .0031,
		"7" => .0036,
		"8" => .0027,
		"9" => .0024,
		"10" => .0021,
		"11" => .0026,
		"12" => .0024,
		"13" => .0036,
		"14" => .0028,
		"15" => .0025
	);

	$graph = new Graph(650, 200);

	$graph->addData($data);
	$graph->setTitle('PPM Per Container');
	$graph->setBars(false);
	$graph->setLine(true);
	$graph->setDataPoints(true);
	$graph->setDataPointColor('maroon');
	$graph->setDataValues(true);
	$graph->setDataValueColor('maroon');
	$graph->setGoalLine(.0025, 'red');

	$file_path = $graph->createGraph('example7', 'F');
Creates graph:
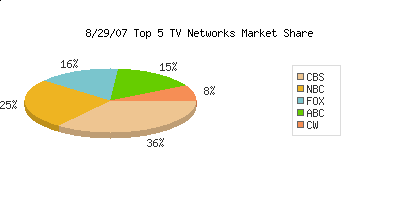
Example 8 - Pie Graph
<?php

    use Noki\PhpGraph\PieGraph;

	$data = array(
		"CBS" => 6.3,
		"NBC" => 4.5,
		"FOX" => 2.8,
		"ABC" => 2.7,
		"CW" => 1.4
	);

	$graph = new PieGraph(400, 200);

	$graph->setTitle('8/29/07 Top 5 TV Networks Market Share');
	$graph->setLabelTextColor('50, 50, 50');
	$graph->setLegendTextColor('50, 50, 50');

	$graph->addData($data);

	$graph->createGraph('example8');
Creates pie graph:
Example 9 - Graph
<?php
    use Noki\PhpGraph\Graph;

	$data = array(
		'alpha' => 23,
		'beta' => 45,
		'cappa' => 20,
		'delta' => 32,
		'echo' => 14
	);

	$data2 = array(
		'alpha' => 15,
		'beta' => 23,
		'cappa' => 23,
		'delta' => 12,
		'echo' => 17
	);

	$data3 = array(
		'alpha' => 43,
		'beta' => 23,
		'cappa' => 34,
		'delta' => 16,
		'echo' => 20
	);

	$data4 = array(
		'alpha' => 23,
		'beta' => 34,
		'cappa' => 23,
		'delta' => 9,
		'echo' => 8
	);

	$graph = new Graph(495, 280);

	$graph->setupYAxis("15");
	$graph->setGradient('teal', '#0000FF');
	$graph->setXValuesHorizontal(true);
	$graph->setXAxisTextColor ('navy');
	$graph->setLegend(true);
	$graph->setLegendTitle('M1', 'M2', 'M3', 'M4');

	$graph->addData($data, $data2, $data3, $data4);

	$file_path = $graph->createGraph('example9', 'F');
Creates graph:
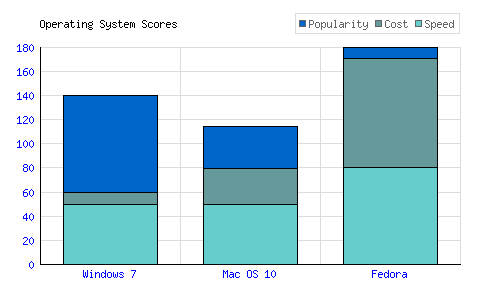
Example 10 - Stacked Graph
<?php

    use Noki\PhpGraph\StackedGraph;

	$popularity = array('Windows 7' => 80, 'Mac OS 10' => 35, 'Fedora' => 9);
	$cost = array('Windows 7' => 10, 'Mac OS 10' => 30, 'Fedora' => 90);
	$speed = array('Windows 7' => 50, 'Mac OS 10' => 50, 'Fedora' => 80);

	$graph = new StackedGraph(500, 300);

	$graph->setTitle('Operating System Scores');
	$graph->setTitleLocation('left');
	$graph->setXValuesHorizontal(true);
	$graph->setTextColor('blue');
	$graph->setBarColor('#0066CC', '#669999', '#66CCCC');
	$graph->setLegend(true);
	$graph->setLegendTitle('Popularity', 'Cost', 'Speed');

	$graph->addData($popularity, $cost, $speed);

	$file_path = $graph->createGraph('example10', 'F');
Creates graph:
Example 11 - Graph
<?php

    use Noki\PhpGraph\Graph;

	$set1 = array (
		1917 => 4011, 1918 => 4886, 1919 => 5411,
		1920 => 5831, 1921 => 5865, 1922 => 5704, 1923 => 5337, 1924 => 5144,
		1925 => 5018, 1926 => 4971, 1927 => 4630, 1928 => 4411, 1929 => 4287,
		1930 => 4116, 1931 => 3940, 1932 => 3764, 1933 => 3592, 1934 => 3447,
		1935 => 3280, 1936 => 3215, 1937 => 3366, 1938 => 3569, 1939 => 3598,
		1940 => 4436, 1941 => 5939, 1942 => 7397, 1943 => 8855, 1944 => 9835,
		1945 => 9998, 1946 => 10631, 1947 => 11340, 1948 => 11549, 1949 => 11642,
	);

	$set2 = array (
		1910 => 2059, 1911 => 2135, 1912 => 2209, 1913 => 2332, 1914 => 2437,
		1915 => 2786, 1916 => 3747, 1917 => 5011, 1918 => 5886, 1919 => 6411,
		1920 => 6831, 1921 => 6865, 1922 => 6704, 1923 => 6337, 1924 => 6144,
		1925 => 6018, 1926 => 5971, 1927 => 5630, 1928 => 5411, 1929 => 5287,
		1930 => 5116, 1931 => 4940, 1932 => 4764, 1933 => 4592, 1934 => 4447,
		1935 => 4280, 1936 => 4215, 1937 => 4366, 1938 => 4569, 1939 => 4598,
		1940 => 5436, 1941 => 5939, 1942 => 8397, 1943 => 9855, 1944 => 10835,
	);

	$graph = new Graph(600, 400);

	$graph->setTitleLocation('left');
	$graph->setTitle("Two sets with different start points");
	$graph->setBars(false);
	$graph->setLine(true);
	$graph->setDataPoints(false);
	$graph->setLineColor('blue', 'red');
	$graph->setDataValues(false);
	$graph->setXValuesInterval(5);
	$graph->setDataValueColor('blue', 'red');
	$graph->setLegend(true);
	$graph->setLegendTitle("set1", "set2");

	$graph->addData($set1, $set2);

	$file_path = $graph->createGraph('example11', 'F');
Creates graph:
🛠 Error Handling
- If the GD library cannot be loaded, a
PhpGraphExceptionwill be thrown.
🧩 Integration with Laravel
You can easily use this package in your controllers, services, or jobs by importing the relevant namespaces:
use Noki\PhpGraph\Graph;
use Noki\PhpGraph\PieGraph;
use Noki\PhpGraph\StackedGraph;
Once imported, you can create graphs and pie charts directly in your application.
📄 License
MIT License. See LICENSE.md for details.
🙌 Contributing
Feel free to fork and submit a PR! Bug reports and feature requests are always welcome.
🔗 Author Of Php Graph Lib
🔗 Contributors
- Novak Urošević
- James Wakelim
- Petr Hurtak
- Pål Saugstad
- Ahmet Gencoglu
- David Gil de Gómez IV
- Manuel R
- Troopster19
📝 Changelog
Please see CHANGELOG.md for recent updates.


