maantje / pulse-database
A Laravel Pulse card for database status
v0.3.0
2025-03-01 19:54 UTC
Requires
- php: ^8.1
- illuminate/support: *
- laravel/pulse: ^1
Requires (Dev)
- mockery/mockery: ^1.5.0
- orchestra/testbench: ^8
- phpunit/phpunit: ^10
This package is auto-updated.
Last update: 2026-04-29 01:27:03 UTC
README
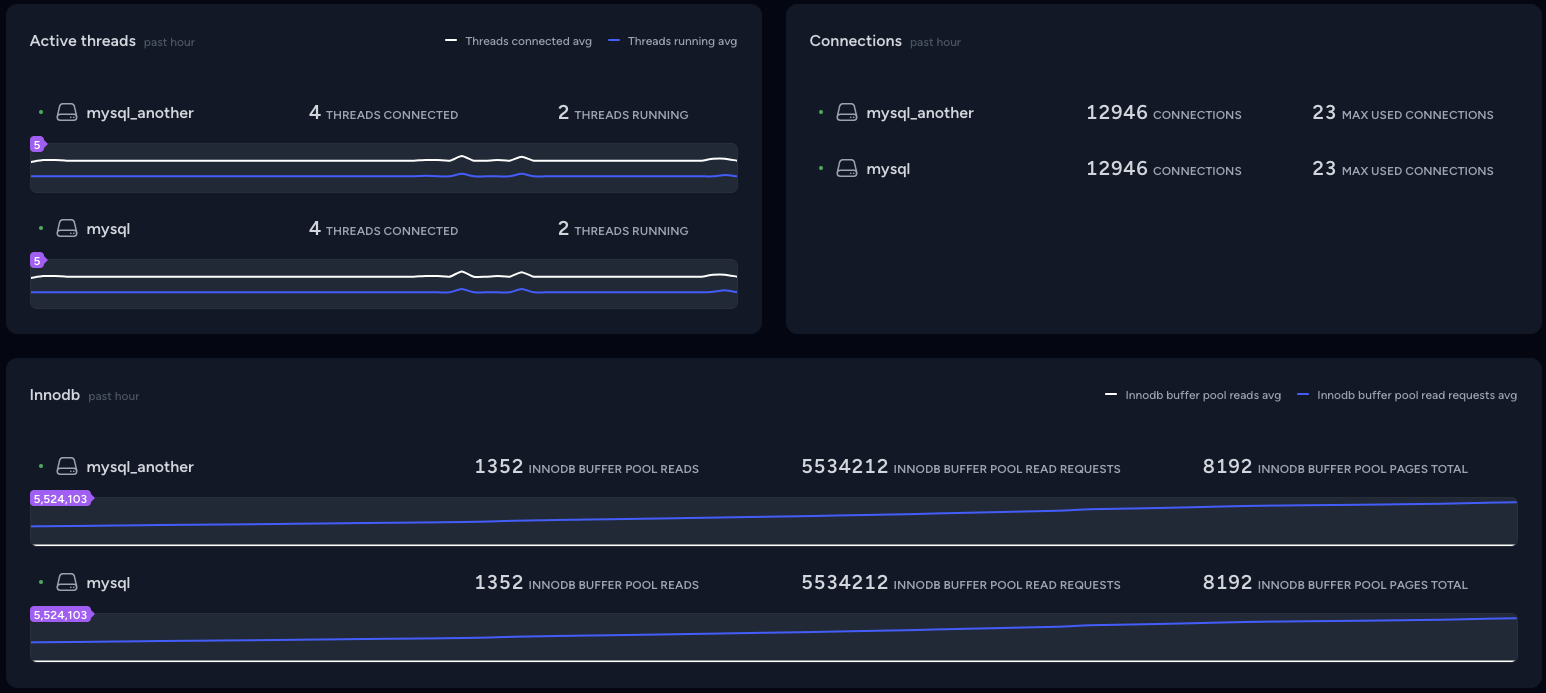
Get real-time insights into the status of your database
Example
Installation
Install the package using Composer:
composer require maantje/pulse-database
Register the recorder
In your pulse.php configuration file, register the DatabaseRecorder with the desired settings:
Uncertain about the available values? You can execute show status against your database to view all the options at your disposal.
return [
    // ...

    'recorders' => [
        \Maantje\Pulse\Database\Recorders\DatabaseRecorder::class => [
            'connections' => [
                'mysql_another' => [
                    'values' => [
                        'Connections',
                        'Threads_connected',
                        'Threads_running',
                        'Innodb_buffer_pool_reads',
                        'Innodb_buffer_pool_read_requests',
                        'Innodb_buffer_pool_pages_total',
                        'Max_used_connections'
                    ],
                    'aggregates' => [
                        'avg' => [
                            'Threads_connected',
                            'Threads_running',
                            'Innodb_buffer_pool_reads',
                            'Innodb_buffer_pool_read_requests',
                            'Innodb_buffer_pool_pages_total',
                        ],
                        'max' => [
                            //
                        ],
                        'count' => [
                            //
                        ],
                    ],
                ],
                'mysql' => [
                    'values' => [
                        'Connections',
                        'Threads_connected',
                        'Threads_running',
                        'Innodb_buffer_pool_reads',
                        'Innodb_buffer_pool_read_requests',
                        'Innodb_buffer_pool_pages_total',
                        'Max_used_connections'
                    ],
                    'aggregates' => [
                        'avg' => [
                            'Threads_connected',
                            'Threads_running',
                            'Innodb_buffer_pool_reads',
                            'Innodb_buffer_pool_read_requests',
                            'Innodb_buffer_pool_pages_total',
                        ],
                        'max' => [
                            //
                        ],
                        'count' => [
                            //
                        ],
                    ],
                ]
            ]
        ],
    ]
]
Ensure you're running the pulse:check command.
Add to your dashboard
Integrate the card into your Pulse dashboard by publish the vendor view.
and then adding the following to the dashboard.blade.php file:
<livewire:database cols='6' title="Active threads" :values="['Threads_connected', 'Threads_running']" :graphs="[
    'avg' => ['Threads_connected' => '#ffffff', 'Threads_running' => '#3c5dff'],
]" />

<livewire:database cols='6' title="Connections" :values="['Connections', 'Max_used_connections']" />

<livewire:database cols='full' title="Innodb" :values="['Innodb_buffer_pool_reads', 'Innodb_buffer_pool_read_requests', 'Innodb_buffer_pool_pages_total']" :graphs="[
    'avg' => ['Innodb_buffer_pool_reads' => '#ffffff', 'Innodb_buffer_pool_read_requests' => '#3c5dff'],
]" />
And that's it! Enjoy enhanced visibility into your database status on your Pulse dashboard.

