kbaas / exestat
Analyze performance for Laravel requests
Requires
- php: ^8.1
- laravel/framework: ^10.0
This package is auto-updated.
Last update: 2026-04-08 04:09:58 UTC
README
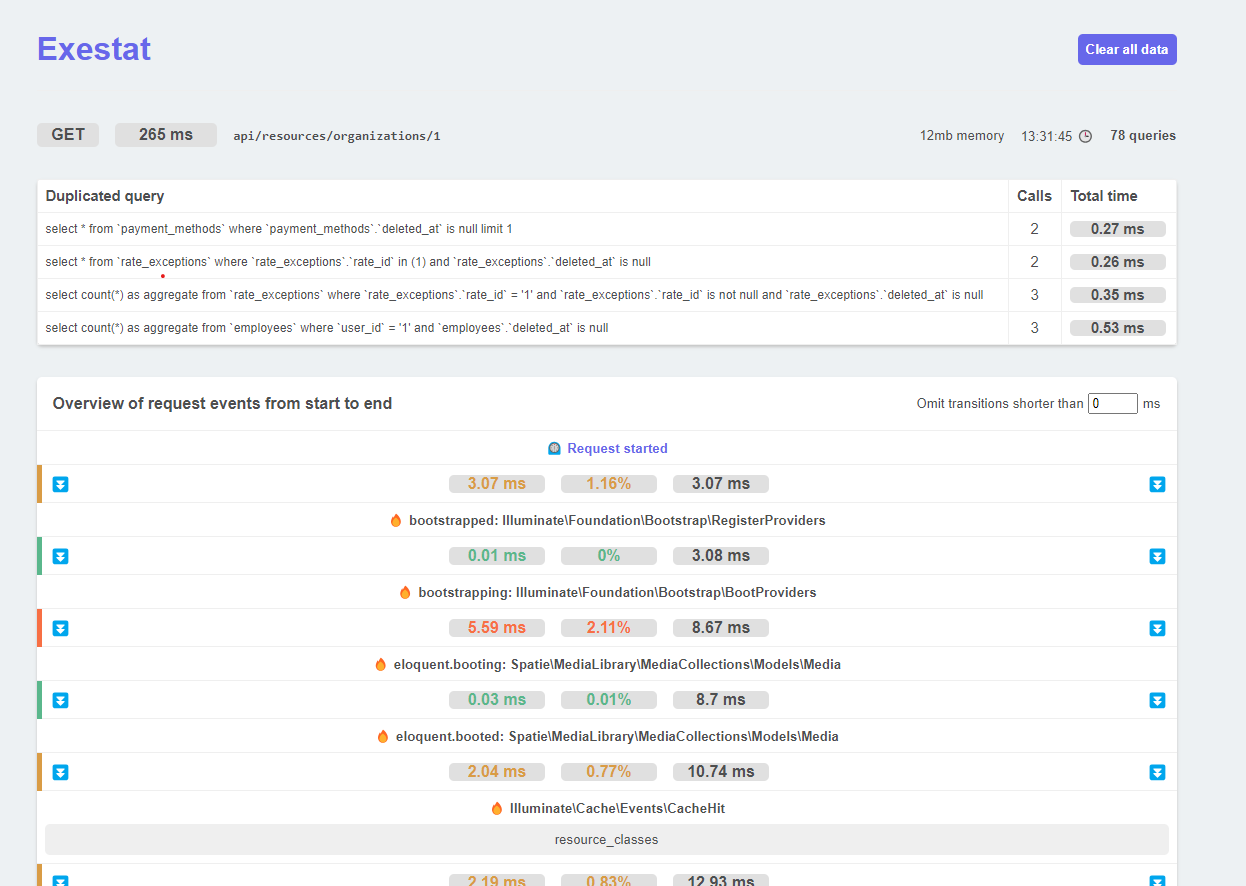
ExeStat provides a simple way to analyze the performance of your Laravel application:
- See how long your requests take.
- See a timeline of your requests and find out which parts of the code are slow.
- See how many queries are done and which ones are duplicated.
- Allows you to add custom "breakpoints" to your timeline.
Installation
Run the following artisan command:
composer require kbaas/exestat
Usage
Visit the /exestat route in your back-end (e.g.: 127.0.0.1:8000/exestat).
Add timeline breakpoints
You can record custom breakpoints for your timeline:
exestat()->record('Before some code');
sleep(1);
exestat()->record('After some code', 'Some addition comments on this event');
Configuration
You can publish the config file with the following artisan command:
php artisan vendor:publish --tag=exestat
This will create a config/exestat.php
Event capturing
By default, all events will be captured and shown in the timeline. You can disable this:
'capture_events' => false,
We already have Telescope, Debugbar etc., why use ExeStat?
There are already excellent tools available like Telescope, Debugbar, Clockwork and many more.
However, I just wanted a very lightweight and simple tool that can easily be accessed by just going to /exestat
without requiring additional setup.
It aims to not slow down your requests (by caching one array per request).

