ilnytskyi / xtc
xDebug to Chromium Google Trace Event Format converter
Maintainers
README
This is a tool for converting xDebug traces into Chromium format that can be visualized in browser's performance tab.

Features
- Converts xDebug trace files into the JSON format used by Chromium
- Command-line interface for easy integration into automated workflows
Requirements
- PHP 8.1 or later
- xDebug 3+ with
xdebug.trace_format=1INI setting
Installation via Composer
- Using composer
composer require ilnytskyi/xtc
- As dev only dependency
composer require --dev ilnytskyi/xtc
Installation from git
- Clone or download this repository to your local machine
- Add
xtcscript to suitable location of your project or link globally
ln -s $(pwd)/xtc /usr/local/bin/xtc
- Use
xtcscript commands to convert your xDebug traces
Usage
For CLI scripts it's recommended to wrap call into trace command:
./vendor/bin/xtc trace --cmd="script.php"
To see exact wrapper command use --debug flag. Try to do self check
./vendor/bin/xtc trace --debug --cmd="./vendor/bin/xtc --help"
The xtc wraps call with correct xDebug params. The output should be like this:
www@3f62bf5fbb1d:~$ ./vendor/bin/xtc trace --debug --cmd="./xtc --help"
Tracing: ./vendor/bin/xtc --help

/app_root/vendor/bin/xtc:564:
string(255) "XDEBUG_MODE=trace XDEBUG_TRIGGER=PHPSTORM /usr/bin/php8.1 -d xdebug.collect_return=0 -d xdebug.collect_params=0 -d xdebug.collect_assignments=0 -d xdebug.trace_format=1 -d xdebug.trigger_value="PHPSTORM" -d xdebug.trace_output_name=xtc_trace.%t xtc --help"

Unknown command: --help
Available commands: trace, convert, watch

Converting /app_root/var/xdebug_dumps/xtc_trace.1699803846.xt

The trace file:                   /app_root/var/xdebug_dumps/xtc_trace.1699803846.xt
Will be processed to:             /app_root/var/xdebug_dumps/xtc_trace.1699803846.xt.json
With following convertOptions
 Show internal PHP functions:     0
 Show arguments:                  0
 Sampling:                        0 μs
Trace is processed successfully /app_root/var/xdebug_dumps/xtc_trace.1699803846.xt.json
Now the /app_root/var/xdebug_dumps/xtc_trace.1699803846.xt.json file can be visualized in a trace viewer.
Generate xDebug traces manually
XDEBUG_MODE=trace XDEBUG_TRIGGER=PHPSTORM php {script.php}

#to capture functions return values
XDEBUG_MODE=trace XDEBUG_TRIGGER=PHPSTORM php -d xdebug.collect_return=1 {script.php}
To convert an xDebug trace file, use the xtc command and specify the input:
./vendor/bin/xtc convert --file=xdebug/dumps/{trace.file}
To automatically move converted JSON traces specify the --out options with filename or folder
./vendor/bin/xtc convert --file=xdebug/dumps/{trace.file} --out=destination/folder/my_trace.json
#OR
./vendor/bin/xtc convert --file=xdebug/dumps/{trace.file} --out=destination/folder/
To watch specific directory
./vendor/bin/xtc watch --dir=xdebug/dumps/
Use same parameters as in convert command to apply to profiles.
Arguments and Return values:
xDebug trace file might collect return values of functions is running with xdebug.collect_return=1 INI setting.
The arguments can also be collected with xdebug.collect_params=1 INI setting.
When trace is converted with --args=1 option you can see the values were passed to function and returned.
Timeline visualization might be extremely useful for debugging or reverse engineering
./vendor/bin/xtc convert --file=xdebug/dumps/{trace.file} --args=1

Use --help option to see more details about command
./vendor/bin/xtc convert --help
./vendor/bin/xtc watch --help
Notice about performance measurement:
- Tracing with xDebug add significant overhead and might increase script execution time by x10!
Here is an example of tracing of same script:
- with xDebug ~10s
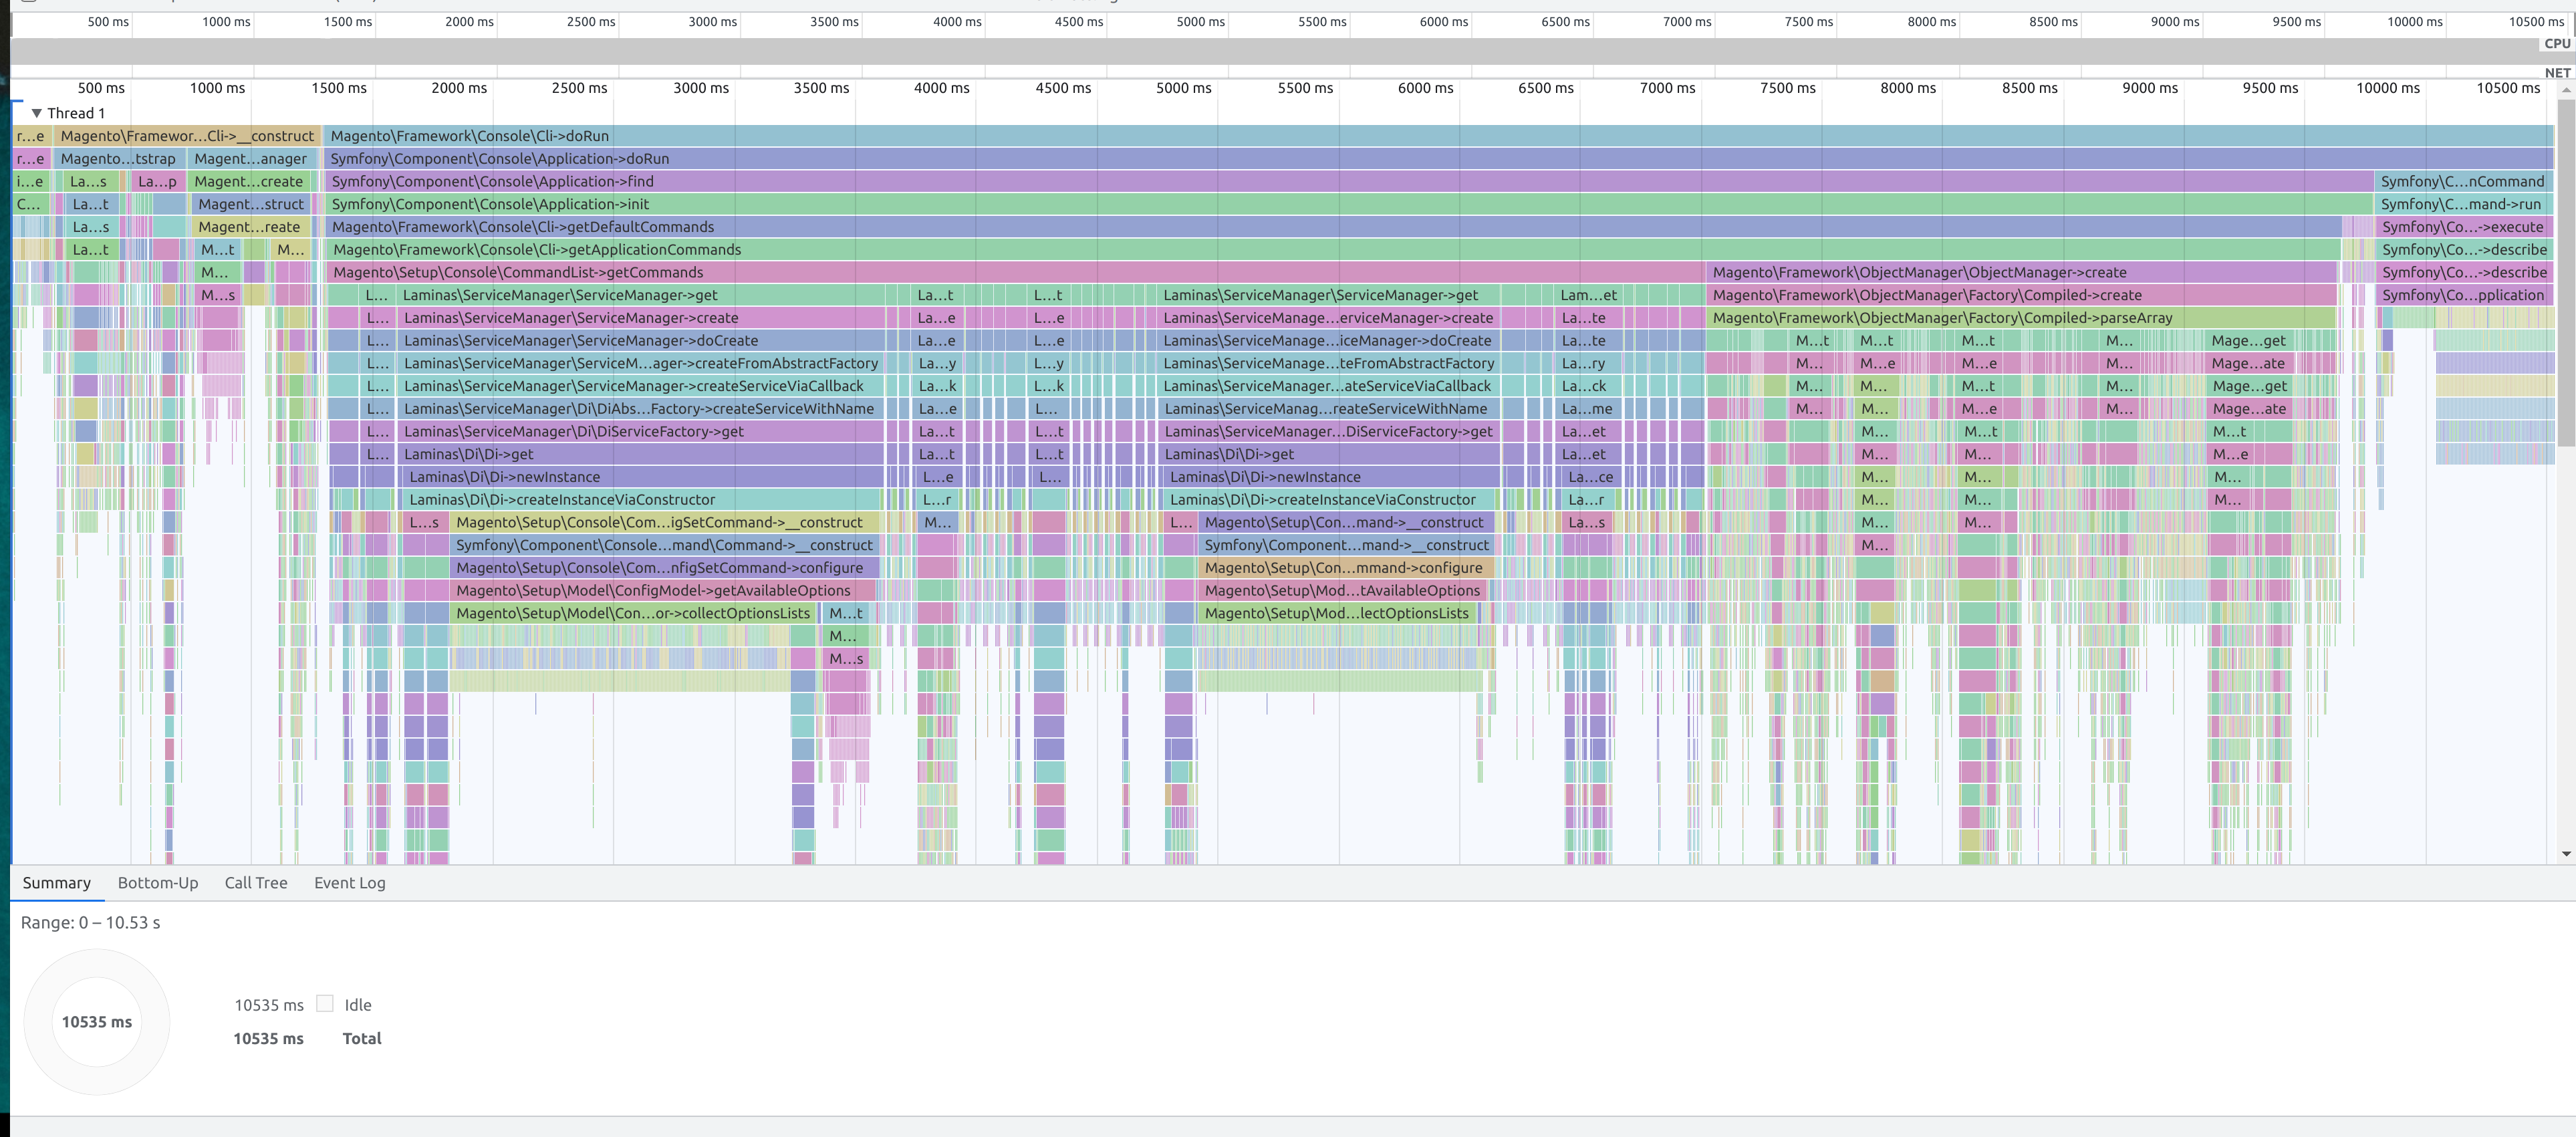
- with SPX ~1s
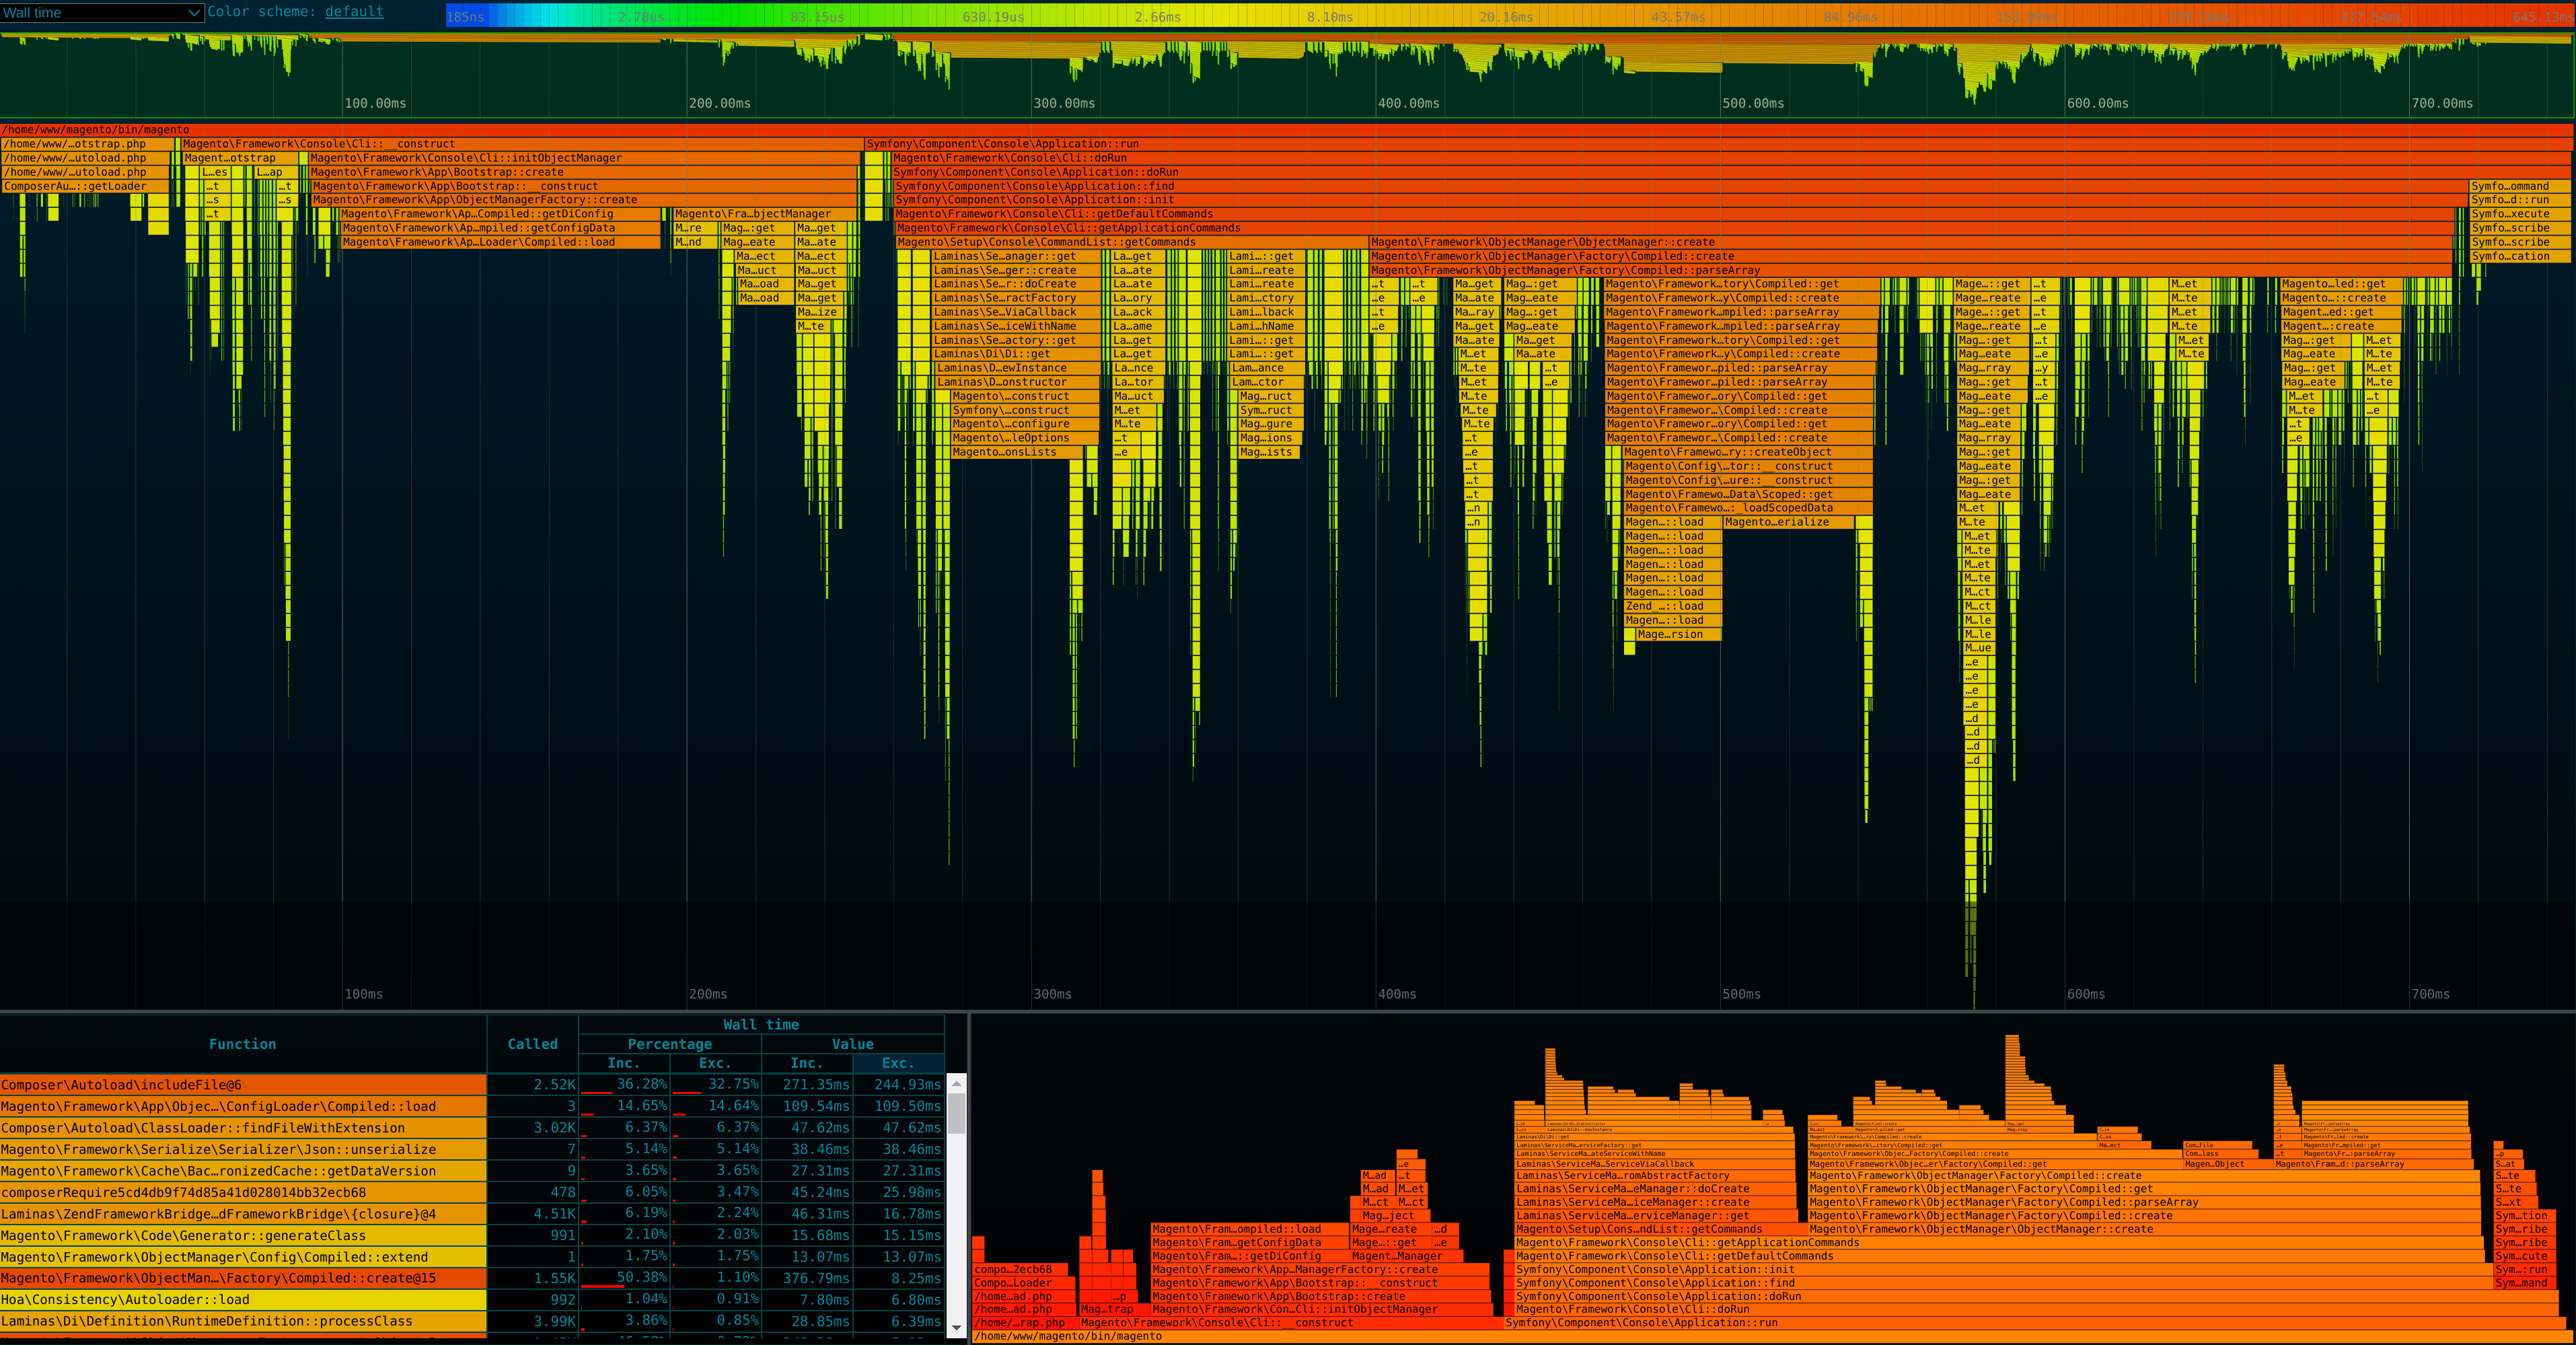


Although the visualized traces of both profilers look similar, it's noticeable that xDebug took about x10 to execute.
- If your goal is to analyze performance it's recommended to use profiler with lower overhead than xDebug.
- If you need more information like arguments/returns values during the execution, you can use xDebug and convert the trace with
./vendor/bin/xtcfor more convenient analysis. - xDebug also collects all calls of php internal functions, but they are excluded by
./vendor/bin/xtcby default. Use--internal=1if you want to see them on timeline.
Visualisation
- Chrome DevTools Performance Tab
Ctr+Shift+J -> Performance - https://ui.perfetto.dev
- https://www.speedscope.app
- Any other Chromium trace (Google Trace Event Format) viewers