fbohorquez / sql-charts-dashboard
Simple PHP library for create SQL charts dashboard
Maintainers
Package info
github.com/fbohorquez/sql-charts-dashboard
pkg:composer/fbohorquez/sql-charts-dashboard
This package is not auto-updated.
Last update: 2026-07-11 12:50:25 UTC
README
![]()
sql-charts-dashboard
Simple PHP library for create SQL charts dashboard
Requirements
Installation
You can use Composer or simply Download the Release
Composer
The preferred method is via composer. Follow the installation instructions if you do not already have composer installed.
Once composer is installed, execute the following command in your project root to install this library:
composer require fbohorquez/sql-charts-dashboard
Finally, be sure to include the autoloader:
require_once '/path/to/your-project/vendor/autoload.php';
Download the Release
If you abhor using composer, you can download the package in its entirety. The Releases page lists all stable versions. Download any file
with the name sql-charts-dashboard-[RELEASE_NAME].zip for a package including this library and its dependencies.
Uncompress the zip file you download, and include the autoloader in your project:
require_once '/path/to/sql-charts-dashboard/vendor/autoload.php';
Using SQL Charts Dashboard Library
Connection
Connection object is a connection to database system. The Connections are used by Query to access the data.
A Connection object has:
- database name
- user
- pass
- host
- engine
$c = new Connection ('database', 'user', 'pass', 'localhost', 'mysqli');
Today library has support for mysqli and pdo_mysql modules. You can build yours class SQL engine implementing this interface
Also you can defined a default SQL engine to all connections in a dashboard.
Dashboard::setDefaultSqlEngine ('pdomysql');
$c = new Connection ('database', 'user', 'pass', 'localhost');
mysqli is init default SQL engine.
Query
Query object is a SQL query. This is a SQL string and a connection to database system. Queries only call database one time, these cache results.
$c = new Connection ('database', 'user', 'pass', 'localhost');
$query = new Query ('SELECT state, COUNT(*) as n FROM offers GROUP BY state', $c);
You can defined a default Connection to all queries in a dashboard.
Dashboard::setDefaultConnection ('database', 'user', 'pass', 'localhost');
$query = new Query ('SELECT state, COUNT(*) as n FROM offers GROUP BY state');

//or

$c = new Connection ('database', 'user', 'pass', 'localhost');
Dashboard::setDefaultConnection ($c);
$query = new Query ('SELECT state, COUNT(*) as n FROM offers GROUP BY state');
Charts
Charts objects represent graphics that draw in client side. There severals types of charts: line, table, pie, area... You must take class corresponding to type of chart. A Chart has a title, Query and a columns defination.
$query = new Query ('SELECT state, COUNT(*) as n FROM offers GROUP BY state');
$chart = new ChartLine (
  'line-chart-example',
  $query,
  [
    'state' => [
        'type' => 'string',
        'label' => 'State',
    ],
    'n' => [
      'type' => 'number',
      'label' => 'Amount',
    ],
  ]
);
Keys of columns defination array must be fields in SQL query.
Default charts engine in client side is google chart (gchart). Optionally you can construct charts with a distinct engine as last parameter in constructor.
Today library has support only for google charts. You can build yours class charts engine implementing this interface
You can defined a default charts engine to all charts in a dashboard.
Dashboard::setDefaultChartsEngine ('gcharts');
Also you can set options to chart object. Options depends of chart engine.
$chart->setOptions (
  [
    'colors' => ['red'],
  ]
);
Also you can set a new query to chart.
$chart->setQuery ($query);
Dashboard
Dashboard object represent charts set. This has a title and chart object or charts objects array. Dashboard object has method html that return HTML string for response.
$dash = new Dashboard ('dashboard-example', $chart);
echo $dash->html();

//or

$dash = new Dashboard ('dashboard-example', [$chart0, $chart1, $chart2]);
echo $dash->html();
HTML is generated with simple view engine. This use concatenate strings for generate a clean struct HTML that contain charts. You can build your view engine implementing this interface. Optionally you can construct dashboards with a distinct view engine as last parameter in constructor. Also you can defined a default view engine to all dashboards.
Dashboard::setDefaultViewEngine ('simple');
You can add new charts to dasboard.
$dashboard->addChart (
  (
    new ChartBar (
      'bar-chart-example',
      $query,
      [
        'state' => [
            'type' => 'string',
            'label' => 'State',
        ],
        'n' => [
          'type' => 'number',
          'label' => 'Amount',
        ],
      ]
    )
  )
);
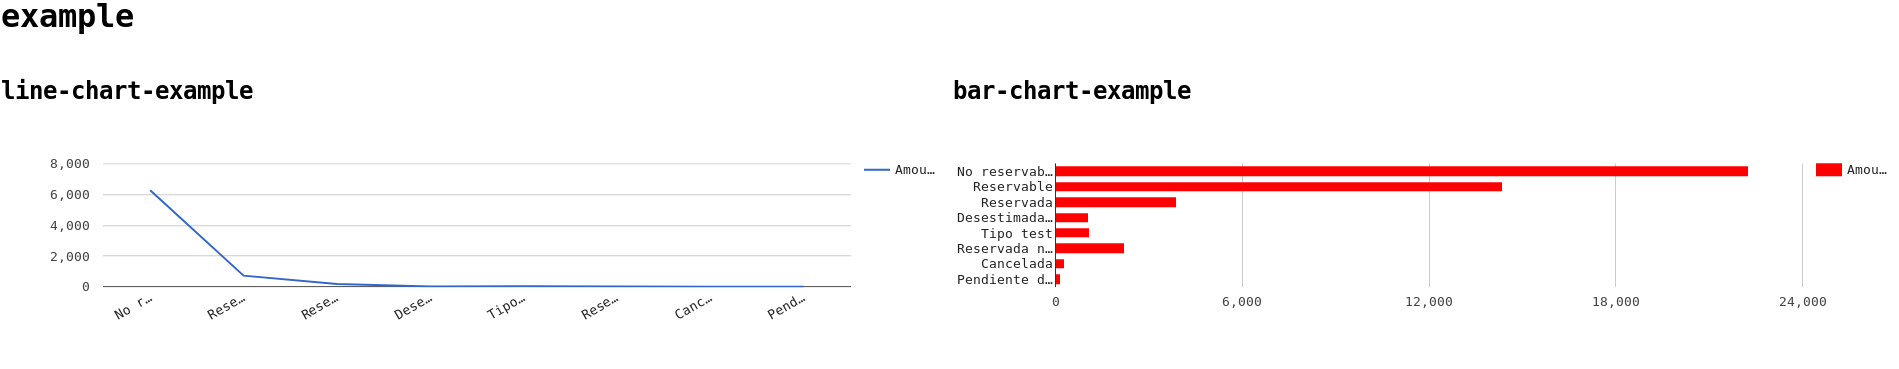
Example
use SqlChartsDashboard\Dashboard;
use SqlChartsDashboard\Query;
use SqlChartsDashboard\ChartType\ChartLine;
use SqlChartsDashboard\ChartType\ChartBar;

Dashboard::setDefaultConnection ('database', 'user', 'pass', 'localhost');

$query = new Query ('SELECT state, COUNT(*) as n, MAX(pvp) as pvp FROM offers GROUP BY state');

echo (
    new Dashboard (
      'example',
      [
        ( // chart0
          new ChartLine (
            'line-chart-example',
            $query,
            [
              'state' => [
                  'type' => 'string',
                  'label' => 'State',
              ],
              'n' => [
                'type' => 'number',
                'label' => 'Amount',
              ],
            ]
          )
        ),
        ( // chart1
          (new ChartBar ('bar-chart-example'))
          ->setQuery ($query)
          ->setColumns (
            [
              'state' => [
                  'type' => 'string',
                  'label' => 'State',
              ],
              'pvp' => [
                'type' => 'number',
                'label' => 'Max PVP',
              ],
            ]
          )
          ->setOptions (
            [
              'colors' => ['red'],
            ]
          )
        )

      ]
    )
)->html();
Autor
Francisco Javier Bohórquez Ogalla
Developed with ♥ by dev2bit