himedia / emr-monitoring
Command line tool for monitoring Amazon Elastic MapReduce (Amazon EMR) jobflows and analyze past jobflows.
Installs: 12
Dependents: 0
Suggesters: 0
Security: 0
Stars: 12
Watchers: 6
Forks: 2
Open Issues: 5
Language:JavaScript
Requires
- php: >=5.3.3
- geoffroy-aubry/errorhandler: 1.*
- geoffroy-aubry/helpers: 1.*
- geoffroy-aubry/logger: 1.*
- psr/log: 1.0.0
- ulrichsg/getopt-php: dev-master
Requires (Dev)
- apigen/apigen: 2.8.0
- phpmd/phpmd: 1.4.*
- phpunit/phpunit: >=3.7
- satooshi/php-coveralls: dev-master
- squizlabs/php_codesniffer: 1.4.*
README
Command line tool for monitoring Amazon Elastic MapReduce (Amazon EMR) jobflows and analyze past jobflows.
Table of Contents
- Overview
- Description
- Installing
- Usage
- Documentation
- Copyrights & licensing
- ChangeLog
- Git branching model
Overview
Description
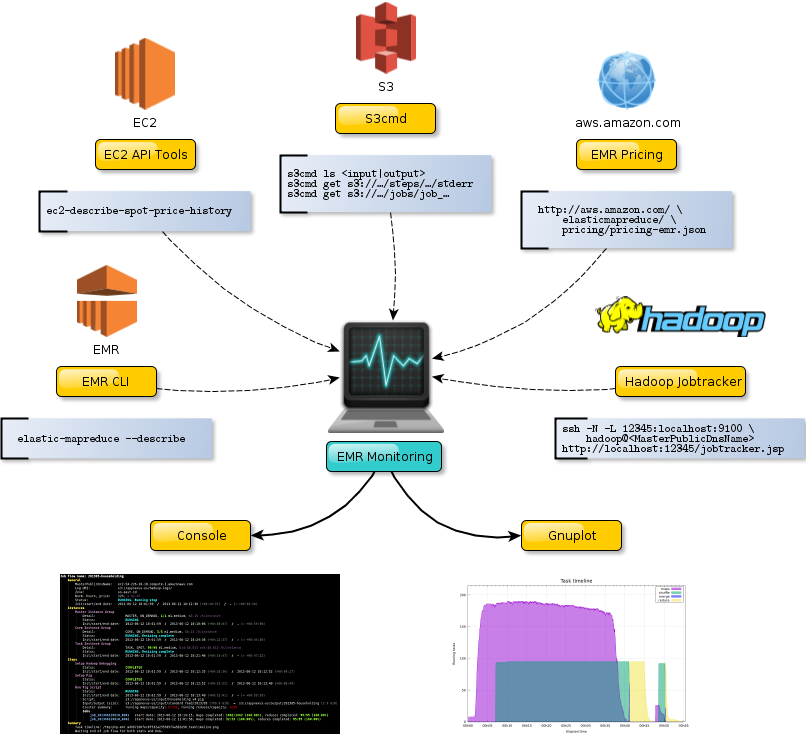
Retrieve information from many places
- Amazon EMR via Amazon Elastic MapReduce Ruby Client to get description of a jobflow:
```bash
$ elastic-mapreduce --describe … ```
- Amazon EC2 via Amazon EC2 API Tools to retrieve history of spots instances price:
```bash
$ ec2-describe-spot-price-history … ```
- Amazon S3 via S3cmd to get size of both input and output files, to retrieve potential errors and to get log summary:
```bash
$ s3cmd ls <input|output> $ s3cmd get s3://…/steps/…/stderr $ s3cmd get s3://…/jobs/job_… ```
-
Amazon Elastic MapReduce Pricing of On-Demand instances via this URL and its underlying JSON service.
-
Hadoop JobTracker running on the master node and accessed by an automatic SSH tunnel:
```bash
$ ssh -N -L 12345:localhost:9100 hadoop@ … $ wget http://localhost:12345/jobtracker.jsp ```
- Additionally, EMR Monitoring computes elapsed times between various events and realizes an estimation of the jobflow's total cost.
All that information is gathered in one screen
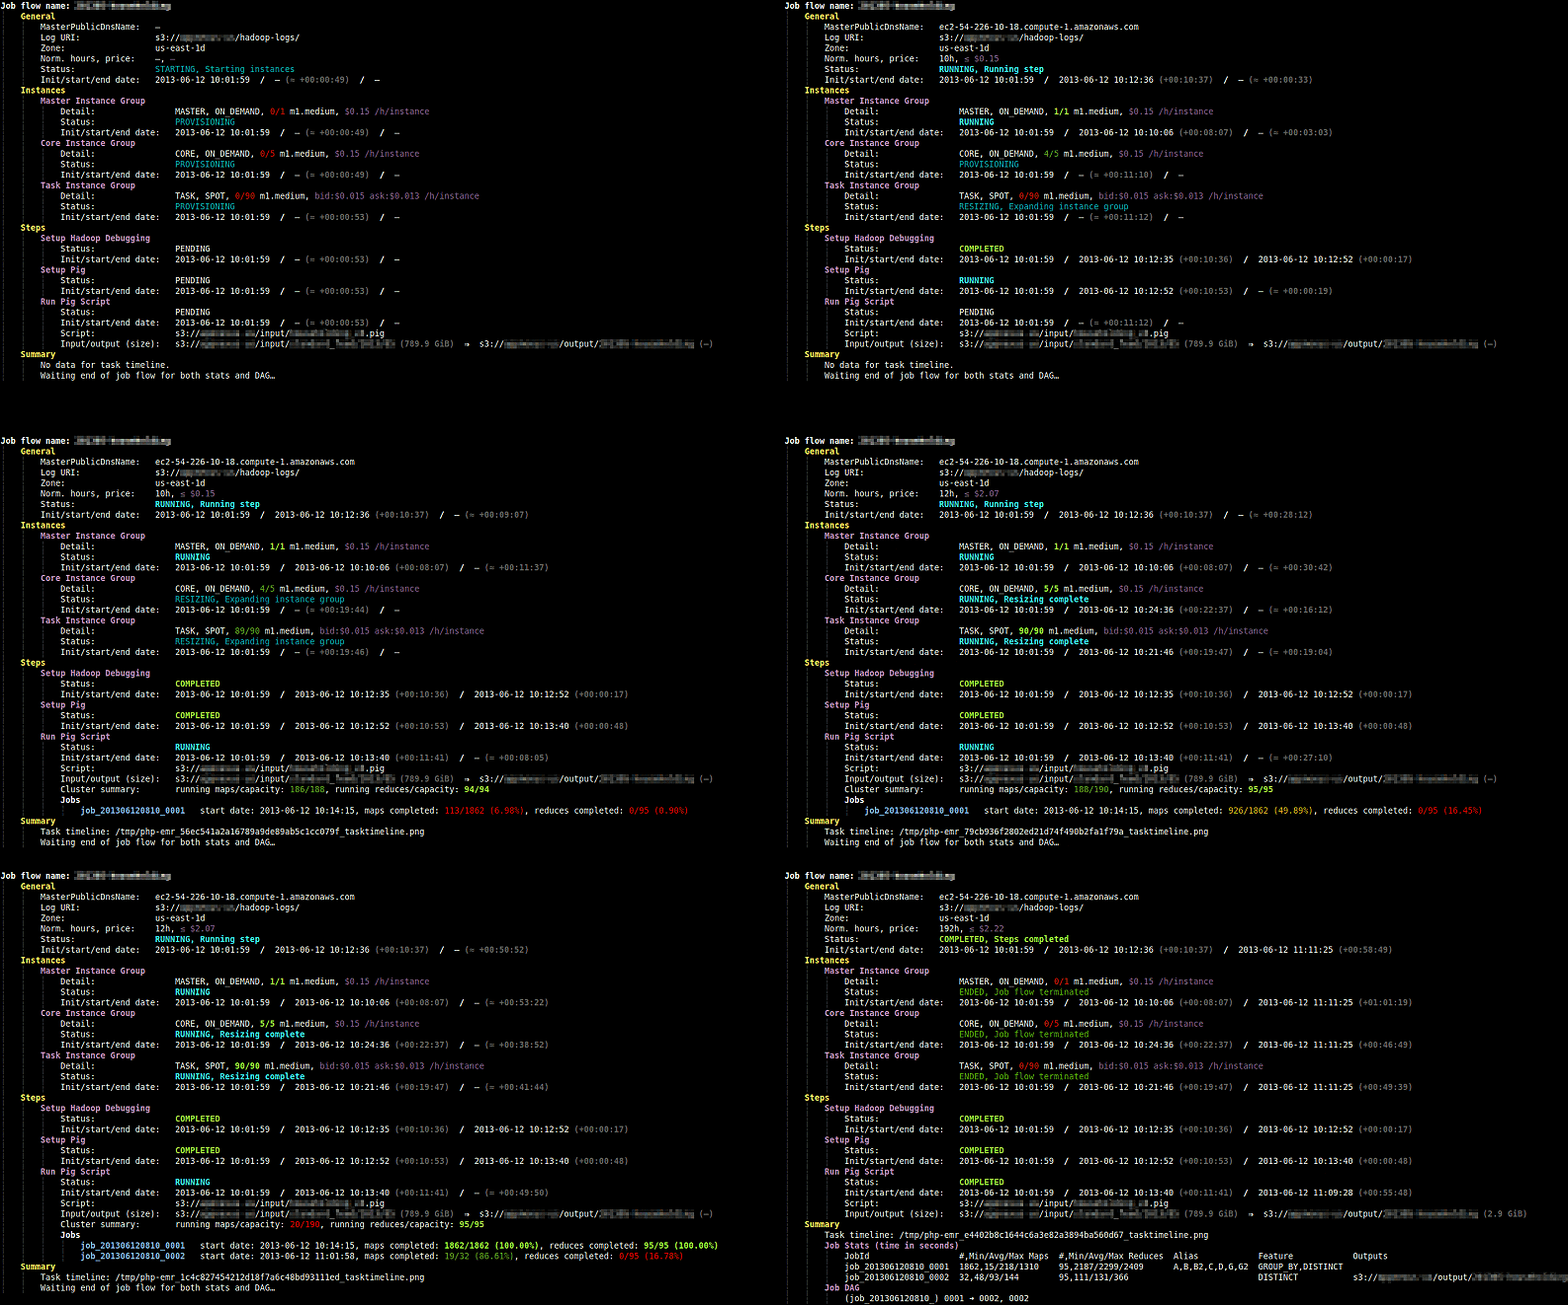
An animation is better than a thousand words:
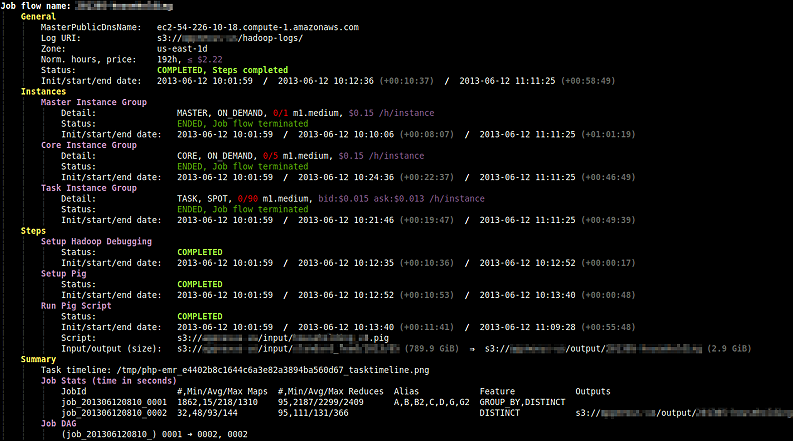
Result with a completed jobflow (click for full resolution image):
Some clarifications
Price
- The ask price for spot instances comes in real time from EC2 API Tools.
- The total price in general section is the sum of the prices of each instance group,
i.e. for each group:
<instance-price> × <number-of-instances> × ceil(<number-of-hours>).
Elapsed times
- Elapsed times in gray measure the time elapsed between initialization and start date of instance/step, and between start date and end date of instance/step.
- When start date or end date is unknown, then elapsed times are computed according to the local time
and a
≈sign is added.
Completion percentages
Completion percentages are computed from Hadoop JobTracker data and are NOT the number of remaining tasks divided by the number of completed tasks.
Error messages
Error messages, if any, are always displayed:
Task timeline
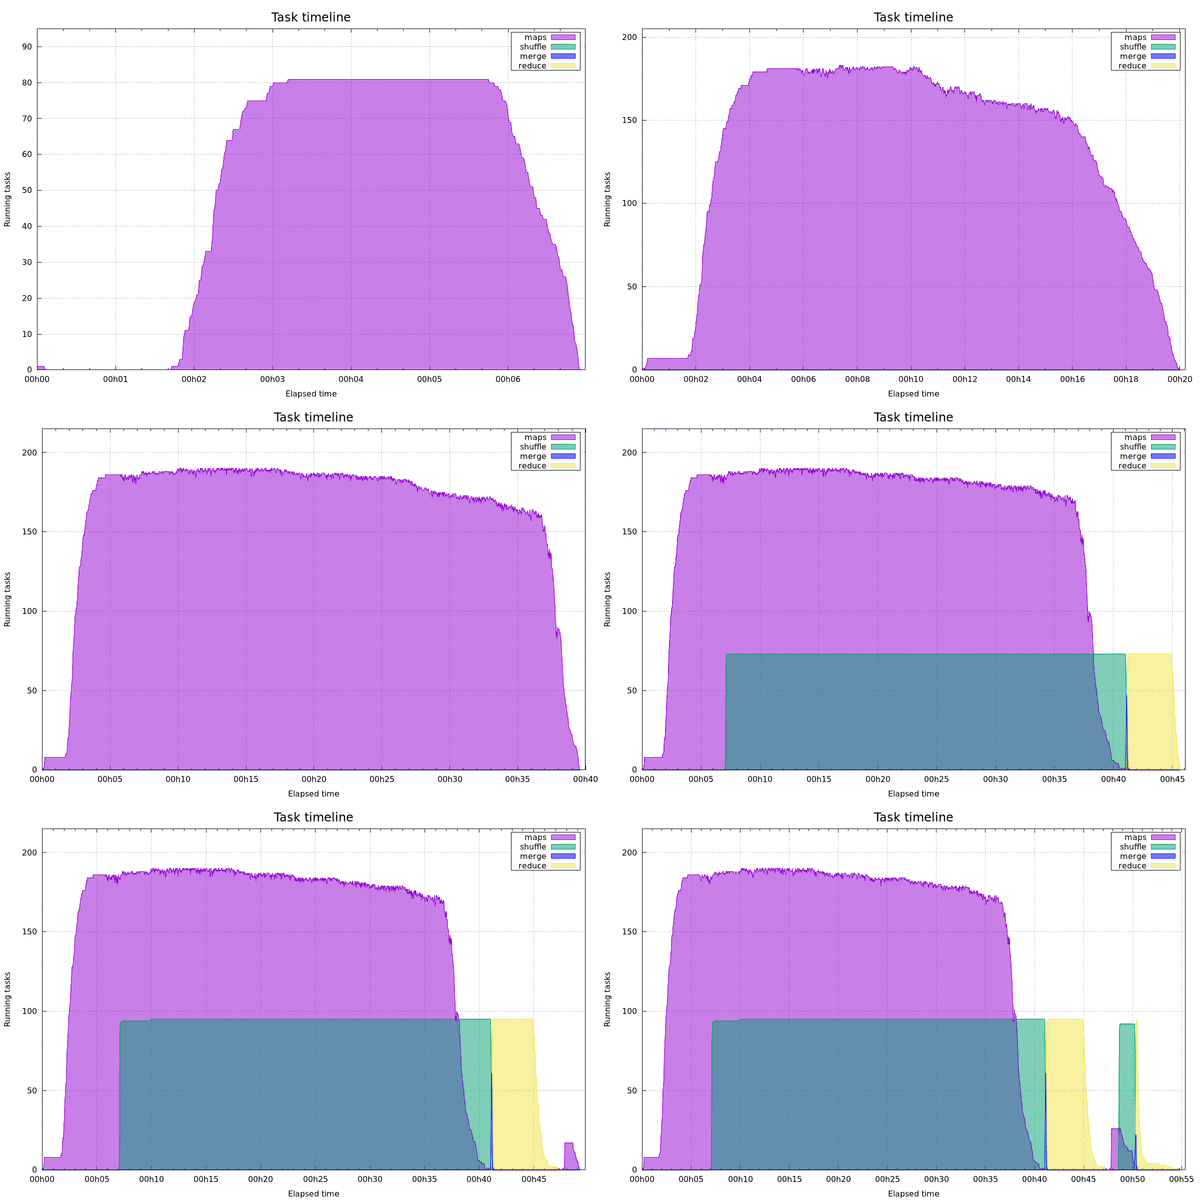
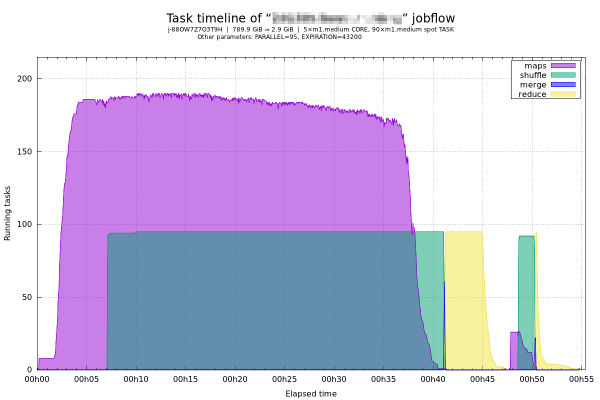
A task timeline is generated via gnuplot including all jobs of in progress or past jobflow and giving details on number of mapper, shuffle, merge and reducer tasks.
Animation from generated task timelines throughout jobflow run:
Result with a completed jobflow (click for full resolution image):
Installing
Git clone
Create a folder, e.g. /usr/local/lib/emr-monitoring, and cd into it.
Then clone the repository (the folder must be empty!):
$ git clone git://github.com/Hi-Media/EmrMonitoring.git .
Configuration
Initialize configuration file from conf/config-dist.php and adapt it:
$ cp '/usr/local/lib/emr-monitoring/conf/config-dist.php' '/usr/local/lib/emr-monitoring/conf/config.php'
If Bash is not your default shell, then fill $aConfig['Himedia\EMR']['shell'] whith your Bash interpreter path, e.g. /bin/bash.
Dependencies
All dependencies are checked at launch and EMR Monitoring systematically helps to resolve them.
Composer dependencies
PHP class autoloading and PHP dependencies are managed by composer.
Text version
To set up the project dependencies with composer, run one of the following commands:
$ composer install
# or
$ php composer.phar install
If needed, to install composer locally, run one of the following commands:
$ curl -sS https://getcomposer.org/installer | php
# or
$ wget --no-check-certificate -q -O- https://getcomposer.org/installer | php
Read http://getcomposer.org/doc/00-intro.md#installation-nix for more information.
EMR CLI
Amazon Elastic MapReduce Ruby Client is needed to get description of a jobflow. Warning: it requires Ruby 1.8.7 and is not compatible with later versions of Ruby.
Text version
To install Amazon EMR Command Line Interface:
$ sudo apt-get install ruby1.8-full
$ mkdir /usr/local/lib/elastic-mapreduce-cli
$ wget http://elasticmapreduce.s3.amazonaws.com/elastic-mapreduce-ruby.zip
$ unzip -d /usr/local/lib/elastic-mapreduce-cli elastic-mapreduce-ruby.zip
Create a file named /usr/local/lib/elastic-mapreduce-cli/credentials.json with at least the following lines:
{
    "keypair": "Your key pair name",
    "key-pair-file": "The path and name of your PEM/private key file"
}
The key-pair-file key is especially used to open a SSH tunnel to the master node and consult Hadoop JobTracker.
If necessary, adapt emr_cli_bin, aws_access_key and aws_secret_key keys
of $aConfig['Himedia\EMR'] in conf/config.php.
Read http://docs.aws.amazon.com/ElasticMapReduce/latest/DeveloperGuide/emr-cli-install.html for more information.
EC2 API Tools
Amazon EC2 API Tools allows to retrieve history of spots instances price.
Text version
To install Amazon EC2 API Tools:
$ wget http://s3.amazonaws.com/ec2-downloads/ec2-api-tools.zip
$ unzip -d /usr/local/lib ec2-api-tools.zip
$ If necessary, adapt ec2_api_tools_dir, aws_access_key and aws_secret_key keys of $aConfig['Himedia\EMR'] in conf/config.php.
$ Set and export both JAVA_HOME and EC2_HOME environment variables.
For example, include these commands in your ~/.bashrc and reload it:
    export JAVA_HOME=/usr
    export EC2_HOME=/usr/local/lib/ec2-api-tools-1.6.7.2
Read http://docs.aws.amazon.com/AWSEC2/latest/UserGuide/setting_up_ec2_command_linux.html for more information.
S3cmd
S3cmd is required to get size of both input and output files, to retrieve potential errors and to get log summary.
Text version
Please run:
$ sudo apt-get install s3cmd
$ s3cmd --configure
Read http://s3tools.org/s3cmd for more information.
Gnuplot
Task timelines are generated via gnuplot for in progress or past jobflow and give details on number of mapper, shuffle, merge and reducer tasks.
Text version
$ sudo apt-get install gnuplot
Usage
Command line options
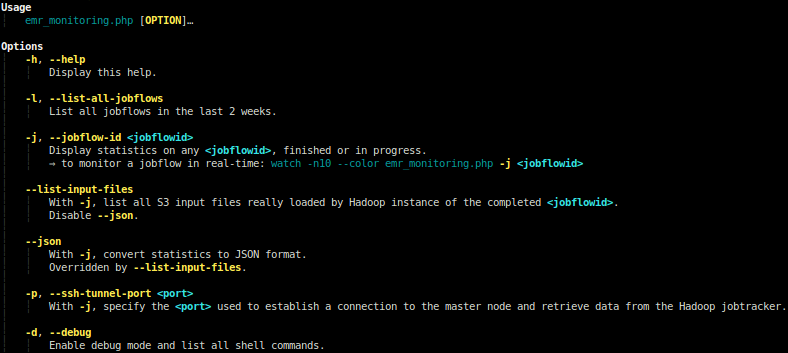
You can view the options by running:
$ src/emr-monitoring.php [-h|--help]
Text version
Usage
    emr_monitoring.php [OPTION]…

Options
    -h, --help
        Display this help.

    -l, --list-all-jobflows
        List all jobflows in the last 2 weeks.

    -j, --jobflow-id <jobflowid>
        Display statistics on any <jobflowid>, finished or in progress.
        ⇒ to monitor a jobflow in real-time: watch -n10 --color emr_monitoring.php -j <jobflowid>

    --list-input-files
        With -j, list all S3 input files really loaded by Hadoop instance of the completed <jobflowid>.
        Disable --json.

    --json
        With -j, convert statistics to JSON format.
        Overridden by --list-input-files.

    -p, --ssh-tunnel-port <port>
        With -j, specify the <port> used to establish a connection to the master node and retrieve data
        from the Hadoop jobtracker.

    -d, --debug
        Enable debug mode and list all shell commands.
With a finished jobflow
Simply:
$ src/emr-monitoring.php -j <jobflowid>
With a new jobflow
-
Launching a jobflow using Amazon Elastic MapReduce:
$ /usr/local/lib/elastic-mapreduce-cli/elastic-mapreduce
--region us-east-1 --log-uri s3n://path/to/hadoop-logs
--create --name my-name --visible-to-all-users --enable-debugging
--pig-script s3://path/to/script.pig
--args "-p,INPUT=s3://path/to/input"
--args "-p,OUTPUT=s3://path/to/output"
--args …
--instance-group master --instance-type m1.medium --instance-count 1
--instance-group core --instance-type m1.medium --instance-count 5
--instance-group task --instance-type m1.medium --instance-count 90 --bid-price 0.015
```
2. You can see it in the list of all jobflows:
```bash
$ src/emr-monitoring.php -l ```

-
Start monitoring of the jobflow:
$ watch -n15 --color src/emr-monitoring.php -j j-88OW7Z7O3T9H ```
You can easily view the task timeline with, for example, [Eye of Gnome](http://projects.gnome.org/eog/):

```bash
$ eog & ```
Documentation
API documentation generated by ApiGen
and included in the doc/api folder.
Copyrights & licensing
Licensed under the Apache License 2.0. See LICENSE file for details.
ChangeLog
See CHANGELOG file for details.
Git branching model
The git branching model used for development is the one described and assisted by twgit tool: https://github.com/Twenga/twgit.

